1. Introduction
The fluxes of materials, water and other chemicals, play key roles in the delivery of ecosystem services (or disservices). For example, the availability of water for human uses depends upon the balance between precipitation and evapotranspiration fluxes in the catchments supplying reservoirs, and tree growth can be constrained by nutrient input and recycling fluxes in soils. Similarly, the delivery of toxic chemicals like aluminum to downstream ecosystems depends upon flux pathways through upland forest ecosystems. Thus, scientists seek to understand and measure flux processes in ecosystems.
The small watershed approach was devised as a means to estimate some key flux processes that are difficult to measure directly. In particular, this approach facilitates estimation of actual evapotranspiration – the total evaporative flux of water from a landscape unit – as well as the flux of chemical elements from soils to surface waters, streams, wetlands, lakes. As detailed in several of the online book chapters this approach permits the construction of chemical budgets and in conjunction with experimental manipulations at the whole-watershed scale, the response of these budgets to disturbances and environmental change.
In the following exercises students will be challenged to make the calculations required to calculate watershed-scale fluxes of water and chemical elements using the data sets of the Hubbard Brook Ecosystem Study.
2. Hydrology
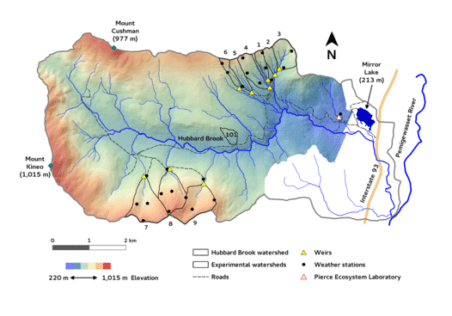
As explained in the Hydrology chapter, the hydrologic budget is calculated at the small watershed scale in units for mm H2O, i.e. analogous to the depth of water measured in a rain gauge. The flux of water from the watershed is measured as volume discharge (e.g., units of L/s) through a V-notch weir at the catchment outlet (Fig. 1, Hydrology chapter). The small watershed is delineated on the basis of surface topography, such that the precipitation falling on the catchment is delivered by gravity to the outlet and that falling outside the catchment to an adjacent watershed unit. To calculate the discharge from a small watershed in units of mm H2O, the volume discharge at the weir must be divided by the area of the catchment from which it was derived. This area could be measured either as planimetric area – the projected area as on maps – or as “on-the-ground” area, measured as such.
Question: Which of these two measurements of watershed area – planimetric or on-the-ground area – would be appropriate for calculating the water budget? Why?
The first calculation you will make is the annual water balance (AET = precipitation – streamflow) for the hydrologic reference watershed (WS3); see Fig. 2 in Hydrology chapter. This balance assumes constant water storage within the watershed; the standard practice in the HBES is to calculate the annual water balance on the basis of the “water year” from 1 June to the following 31 May. The assumption underlying the water-year is that the volume of water stored within the small watershed is roughly equal every year following drainage of the spring snowmelt and prior to high root uptake supplying transpiration by the vegetation.
In recent years the long-term water balance at the HBEF reference watersheds suggests that the assumption of constant water storage in spring may be false.
Question: What water storage pool in the catchment might be changing through the years? Why? How could you verify whether this storage pool has been changing?
In the data set set entitled “Daily Streamflow by Watershed” , the data for daily streamflow are published in units of mmH2O/day, converted from instantaneous volume discharge at the weir. See sidebar for data access instructions. For a detailed description of the methods underlying this file you can view the metatdata as displayed when you select the dataset, and/or download the metadata. Using these data, first calculate annual discharge in water year 2013-2014 for the hydrologic reference watershed (WS3). For this purpose you can copy the data for this water-year from the file and paste into Excel or any spreadsheet. Next, calculate total annual precipitation for this year and watershed using the data set entitled, “Daily Precipitation by Watershed” which can be located and accessed in a similar way
Question: Rainfall is measured with several standard rain gauges scattered around the HBEF and the amount of rain varies among rainfall stations. How could these “point measurements” of rainfall be converted to represent the whole watershed rainfall flux for any particular watershed?
Now calculate annual actual evapotranspiration (AET) for WS3 in water year 2013-2014.
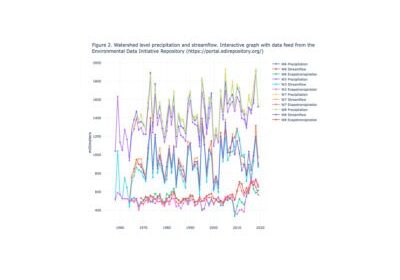
As illustrated in Fig. 2, Hydrology chapter, AET in WS3 has apparently declined slightly over the long period of record, 1958-2014. This observation is hard to reconcile with increasing air temperatures at HBEF (see Ch. 8) in that heat energy drives AET. We also see considerable annual variation in estimated AET. We might hypothesize that annual variation in AET is caused by climate; we would predict higher AET in warm than colder growing seasons. You can test this hypothesis by quantifying the relationship between daily average air temperature from 1 June to 30 September (growing season) and annual AET for the years 1995-2010. Daily air temperature data are found in the data file entitled, “Daily Mean Temperature”; for convenience you can use the temperature data for station 1. To save you tedious work, we provide the annual AET for the years 1995-2010 [download file].
Question: How can we reconcile the observed positive relationship between AET and growing season temperature with the long-term decline in AET in the warming climate?
Next we will observe the effects of forest cutting on stream discharge and the forest ecosystem water balance. In winter 1984-1985 the forest on WS5 was clearcut in a whole-tree harvest. Using the precipitation and stream discharge data sets introduced above, evaluate the effect of this treatment on water yield and AET, i.e. compare AET in WS5 between 1983 (pre-cut) and 1985 (post-cut).
Question: It has been proposed that forest cutting could be an effective strategy to increase water supply for human uses. What do the results from the WS5 experiment suggest?
3. Streamwater nutrient fluxes
The small watershed approach facilitates the estimation of nutrient losses from the ecosystem resulting from leaching of soils by percolating water. Essentially, the streamwater integrates all the pathways of nutrient flux through the infinitely complex soil pore network.
First we will calculate the annual flux of calcium from the biogeochemical reference watershed (WS6) for two different years, one early in the record (1965) and one late in the record (2010). To calculate these fluxes go to the data set entitled, “Chemistry of Streamwater, Watershed 6”, again by scrolling down in the data catalog. In this data set the researchers present the monthly average concentration of various chemicals in units of mg/L. They also present stream discharge for each month in units of mmH2O. Streamwater Ca flux for these years can be estimated as the sum of over 12 months (kg-ha-1-yr-1) of the product of Ca concentration and water flux. To make this calculation you will need to make unit conversions; note that “mmH2O” is essentially the same as mm3/mm2 and again the concentration units are in mg/L. In the copied spreadsheet you will sum the product of these values for the twelve months in the year 1965 and 2010 and then make the appropriate unit conversions to express as kg-ha-1-yr-1.
Question: On the basis of this limited sample has Ca flux from WS6 likely declined, increased or remained constant since the 1960s? Why?
Bormann et al. (1974) showed that the elimination of plant root uptake by devegetation of WS2 caused a striking increase in nutrient loss by leaching from soils to the stream. Using the dataset entitled “Chemistry of Streamwater, Watershed 2”, compare streamwater Ca export for WS2 in the year before (1965) and two years after (1968) devegetation of WS2.
Question: Did the increase in Ca loss following devegetation on WS2 result primarily from increased water flux or increased streamwater Ca concentration? What was the principal mechanism that caused increased base cation losses following devegetation of WS2 (Clue: see Ch. 7 Nitrogen cycle)?
4. Element input in bulk precipitation
A simple funnel apparatus has been used since 1963 to collect rain water for analysis of dissolved chemicals. Element flux via so-called “bulk deposition” can be calculated as the product of precipitation amount and chemical concentrations, analogous to the streamwater flux, above. Using the dataset entitled, “Chemistry of Bulk Precipitation, Watershed 6” calculate the annual input flux of Ca to WS6 for the same two years (1965, 2010) for which you previously calculated stream output. Again the monthly water input (mmH20) and the average monthly water chemistry (mg/L) are summarized in the file and the same sort of unit conversions are needed,
Question: On the basis of this limited sample has bulk precipitation input of Ca likely increased, decreased or remained constant since the 1960s? Why? Do you suppose that the changing bulk precipitation inputs largely explain the changing stream losses of Ca? Why or why not?
5. Nutrient Accumulation in Forest Vegetation
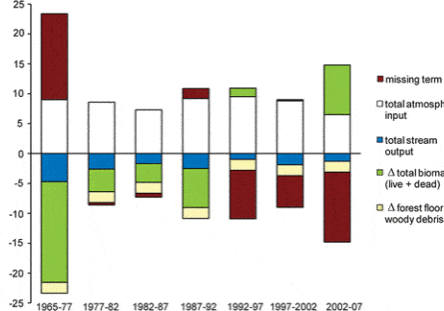
The vegetation is often the most dynamic nutrient pool or stock in the forest ecosystem. Forest disturbances like severe windstorms, or clearcutting, initiate the process of secondary succession and consequent rapid accumulation of nutrients in the vegetation. We can calculate this flux by estimating the biomass of the vegetation and nutrient concentrations in the plant tissues at two different points in time. Whittaker et al. (1974, 1979) reported that the living biomass of the forest on WS6 averaged 16107 grams/m2 and the calcium content of the forest was 50.7 grams/m2. Between 1965 and 1992 the forest on WS6 continued to accumulate biomass and mineral nutrients. In 1997 the diameter of every tree on WS6 was measured, and the biomass of each tree was estimated using regression equations relating diameter and biomass as determined by felling and weighing lots of trees (Whittaker et al. 1974, Siccama et al. 1994). The weight of each tree in 1997 is compiled in the following data file [download file]. Calculate the total biomass of the WS6 forest in 1997 using these data. Express the value on a unit area basis using the measured planimetric area of WS6 (13.2 ha). Finally calculate the calcium content of the forest on WS6 in 1997 using the average concentration of calcium in the vegetation: 3.13 mg Ca/gram dry weight. How does the Ca content of the forest compare between 1965 and 1997?
Question: Calcium rapidly accumulated in tree biomass in the youngish forest on WS6 between 1965 and 1987. What do you suppose was the principal source of that Ca?
6. Net soil release
In the long term, primary mineral weathering is the principal pathway supplying nutrients with sedimentary cycles (e.g., P, K, Ca); however, measurement of mineral weathering at the scale of forest ecosystems is difficult. One approach to the problem of measuring mineral weathering is to utilize the small watershed mass-balance:
Weathering input = stream output – precipitation input + ∆ storage
In this formulation ∆ storage refers to changes in element content of any of the major storage pools in the ecosystem, including forest floor organic matter, mineral soils and vegetation.If we assume that the forest floor and mineral soil pools (excluding primary minerals) are constant, then weathering of an element can be estimated from the foregoing calculations in sections 2 to 5. By convention we refer to this formulation as “net soil release” because it actually represents primary mineral weathering plus any unmeasured long-term changes in other soil pools such as soil organic matter or secondary minerals (e.g. clays).
The calculation of net soil release is usually conducted over a relatively long-time span largely because the ∆ storage for the vegetation pool is estimated on the basis of long-term increases in tree diameters. Calculate annual net soil release of Ca for WS6 averaged over the time interval for which you previously calculated ∆ storage in biomass (1965-1997).For this you need to calculate the total bulk precipitation input and stream output over this entire interval, as previously explained in sections 3 and 4, above. These can be readily calculated in Excel using the data files on chemistry of bulk precipitation and streamflow that you accessed.
Question: An independent estimate of primary mineral weathering of Ca during this interval is 2.8 kg/ha-yr. What does this estimate imply about overall changes in the soil pool during this interval of relatively intense acid deposition?
The whole-tree harvest (WTH) of WS5 in 1985 was expected to seriously deplete soil Ca pools because unlike standard harvest in which lots of Ca is left behind in branches and twigs, much more Ca was removed from the site by WTH. Assuming that all the aboveground vegetation was removed from the site, compare the amount of Ca removed in this treatment vs. the net soil depletion from 1965 to 1997 on WS6 calculated above as the difference between net soil release and the independent estimate of primary mineral weathering rate. For convenience simply assume that the Ca content of the vegetation on WS5 prior to harvest was equal to that on WS6 in 1997 (calculated above). What would you conclude about acid deposition vs. forest harvest as causes of soil calcium depletion in the 20th century?
Access to Data
Data for these exercises can be found in the Environmental Data Intiative Repository (EDI).
At the links below, you can download the necessary datafiles. If you are working in a scripted language, see the 'code generation' feature on the dataset landing page. This will provide you with a direct link to the data, which can then be read directly into your workflow. If there has been a data update, since the publication date of this webpage, you will see a link to the newer data at the top of the dataset landing page.
-
USDA Forest Service, Northern Research Station. 2020. Hubbard Brook Experimental Forest: Daily Streamflow by Watershed, 1956 - present ver 11. Environmental Data Initiative. https://doi.org/10.6073/pasta/d10220595119b502fe2ac14833fa4b9b.
-
USDA Forest Service, Northern Research Station. 2021. Hubbard Brook Experimental Forest: Total Daily Precipitation by Watershed, 1956 - present ver 14. Environmental Data Initiative. https://doi.org/10.6073/pasta/dc5880a6956f0cdd706d1c13b13e23c3 (Accessed 2022-06-27).
-
USDA Forest Service, Northern Research Station. 2021. Hubbard Brook Experimental Forest: Daily Temperature Record, 1955 - present ver 10. Environmental Data Initiative. https://doi.org/10.6073/pasta/3afab60d54d5f2fcb1112e71f4be2106 (Accessed 2022-06-27).

