Chapter Editor(s): Timothy Fahey
For over 60 years scientists have been studying the dynamics of forests and linked aquatic ecosystems in the Hubbard Brook Experimental Forest, New Hampshire, USA. The Hubbard Brook Ecosystem Study (HBES) is an ongoing effort to understand the ecology, hydrology, energetics and biogeochemistry of this temperate forest ecosystem. The synthesis that follows provides an overview of several components of the HBES interpreted in light of current understanding at the level of the advanced student. The objective is to provide interested researchers with a succinct summary that will be helpful for guiding research and education efforts.

Figure 1. Map of the Hubbard Brook Experimental Forest
Site Description
The Hubbard Brook Experimental Forest (HBEF) is located in the southern part of the White Mountain National Forest (WMNF) in central New Hampshire (Figure 1). The HBEF is characteristic of much of the White Mountain National Forest (Fahey et al. 2015) The National Forest has hilly, occasionally steep topography; coarse, acidic, glacially-derived soils; bedrock dominated by metamorphic rock of igneous and sedimentary origin; northern hardwood forests on lower slopes and spruce-fir forests at higher elevations (above ca. 800 m).
Climate
The continental climate at the HBEF features long, cold winters and mild to cool summers (see Climate chapter). Major air flow over the forest is either (1) continental polar air from subarctic North America (the predominant direction), (2) maritime tropical air from the Caribbean and Gulf of Mexico from the south or southwest, or (3) maritime air from the North Atlantic out of the east or northeast. In spite of the proximity of Hubbard Brook to the ocean (116 km), the climate is predominantly continental.
Annual precipitation averages about 1,400 mm, of which about one third to one quarter is snow. A snowpack usually persists from mid-December until mid-April, with a peak depth in March of about 1,000 mm, having about 250 to 300 mm of water content.
Winters are long and cold. January averages about -9oC, and long periods of low temperatures from -12˚C to -18˚C are common. Even though temperatures are low most of the time, occasional midwinter thaws result in elevated streamflow. Short, cool summers are the rule. The average July temperature is 18oC.
The average number of days without killing frost is 145; however, the growing season for trees is considered to be from 15 May, the approximate time of full leaf development, to 15 September, when the leaves begin to fall.
The estimated annual evapotranspiration (ET) is about 500 mm, determined by difference between precipitation and streamflow. This calculation is a reasonable approach for Hubbard Brook because of the apparent minimal deep seepage and annual removal of summer soil-water deficits by autumnal rains and spring snowmelt.
Geology
The eastern portion of the Experimental Forest (watersheds 1-6, and 9 included; Figure 1) is underlain by a complex assemblage of metasedimentary and igneous rocks. The major map unit is the Silurian Rangeley Formation, consisting of quartz mica schist and quartzite interbedded with sulfidic schist and calc-silicate granulite. Originally deposited as mudstones, sandstones and conglomerates, these rocks have been metamorphosed to sillimanite grade and have undergone four stages of deformation. Deformation style evident in outcrops is primarily tight isoclinal folds. However joints, slickensides and mylonites indicate brittle deformation as well. The metamorphic rocks were later intruded by a variety of igneous rocks including the Devonian Concord Granite, pegmatites, and Mesozoic diabase and lamprophyre dikes. The western portion of the forest (portions of watersheds 7 and 8 included) is underlain by the Devonian Kinsman Granodiorite, a foliated granitic rock with megacrysts of potassium feldspar.
Continental glaciers, which blanketed the region during the Pleistocene and retreated some 13,000 years ago, removed most preexisting soils. Glacial movement was primarily in a southeasterly direction as indicated by striations on bedrock surfaces, and by fragments of rocks in the till which are typical of bedrock to the northwest of the Hubbard Brook Valley. Materials deposited by the glacier are highly variable in degree of sorting and grain size, ranging from clays to 10m diameter boulders. The depth of glacial deposits ranges from zero on ridgetops and in stream valleys (resulting in bedrock outcrops) to 50m in the vicinity of Mirror Lake. Poorly sorted glacial till, commonly 2m thick, covers the bedrock in most of the valley. Ice contact terraces in the lower valley, consisting of well sorted sands and gravels, are typically tens of meters thick.
Soils
In the HBEF soils are predominantly well-drained Spodosols, more specifically, Typic Haplorthods derived from glacial till, with sandy loam textures. There are no residual soils, (i.e., derived from weathered bedrock). Principal soil series are the sandy loams of the Berkshire series, along with the Skerry, Becket, and Lyman series. These soils are acidic (pH about 4.5 or less) and relatively infertile (Table 1). A 20- to 200-mm thick forest floor layer is usually present. Soils on the ridgetops may consist of a thin accumulation of organic matter, resting directly on bedrock.
| Table 1. Summary soils data for Watershed 5 at the HBEF (after Johnson et al. 1991a,b). | |
| Soil Types: | Typic Haplorthod Typic Dystrochrept |
| Soil Series: | Berkshire, Skerry, Becket, Lyman, Tunbridge |
| Avg. Depth (cm): Forest Floor Mineral Soil |
6.9 50.3 |
| Mass (kg/m2): Forest Floor Mineral Soil |
8.8 317.0 |
| Soil Organic Matter (%): Forest Floor Mineral Soil |
60.0 10.0 |
| pH in Water: Oa Horizon Mineral Soil |
3.9 4.3 |
| Cation Exchange Capacity (cmol/kg): Oa Horizon Mineral Soil |
18.0 5.0 |
| Base Saturation (%): Oa Horizon Mineral Soil |
50.0 12.0 |
The separation between the pedogenic zone and the virtually unweathered till and bedrock below is distinct. Depth to the C horizon averages about 0.6 m. At various places in the Forest, the C horizon exists as an impermeable pan. These layers restrict root development and water movement. Rocks of all sizes are scattered throughout the soil profile. In many locations boulder fields are prominent features.
A prominent feature of the surface topography throughout the HBEF is the rough pit-and-mound appearance caused by the uprooting of trees. Uprooting mixes mineral soil from lower mineral horizons with nutrient-rich organic surface layers or it can deposit the lower mineral layers directly on top of the forest floor humus layers without mixing, creating buried horizons. This natural disturbance changes seedbed conditions for regenerating species, and affects weathering and biogeochemical cycles.
Streams
Although stream channels occupy only 1% of the land area, the streams play an important role in many processes throughout the HBEF. The numerous streams in the HBEF range from small ephemeral channels that often dry up during summer to a large perennial 5th-order stream (Hubbard Brook). Because of the shallow soil depths and high soil porosity, the stream channels quickly swell during large storms (e.g., 80 mm or more). As much as 60 to 80% of storm precipitation can pass through the stream as storm flow.
Streamwater is usually characterized by low concentrations of suspended materials due to the coarse-grained texture of the soil. Mineral and organic particulate material is suspended and carried in storm periods, but once the flow recedes these materials quickly settle, leaving the stream with low concentrations of suspended solids. About 28 kg/ha of particulate matter (both inorganic and organic) are transported out of the watershed by streams each year.
Most of the stream channels have exposed bedrock at some locations. However, the first to third order streams have channels primarily made up of mineral and organic particulate matter lodged behind organic debris dams. These dams form a stair-step pattern in stream channels, and they play important roles in regulating many physical, chemical, and biological processes in the streams.
Historical Perspective
The Hubbard Brook Experimental Forest was established by the U.S. Department of Agriculture (USDA) Forest Service in 1955 as a major center for hydrologic research in New England. The initial size delineated for research was a 3,037-ha, bowl-shaped Valley (Figure 1).
During the first eight years following the establishment of the HBEF, the Northeastern Research Station of the USDA Forest Service developed a network of precipitation and stream-gauging stations, and installed weather instrumentation, as well as soil and vegetation monitoring sites on small experimental watersheds. Data from these installations combined with several initial studies formed the hydrometeorologic foundation for much of the future research at the HBEF. The major emphasis in these early studies was to determine the impact of forest land management on water yield,water quality, and flood flow.
The Hubbard Brook Ecosystem Study originated in 1960 with the idea of using a small watershed approach to study element flux and cycling. The initial development of the HBES was slow and deliberate. The entire effort during the first two years, 1963-1965, was conducted by three scientists and one technician at Dartmouth College and three scientists and one technician from the USDA Forest Service (USDA-FS). At that time, there were no precedents to follow since comprehensive studies of ecosystems had not been initiated. Using the small watershed approach, studies of element-hydrologic interactions were conducted to form a basis for subsequent process-level and experimental research. In this regard, the investigators were fortunate to rather quickly develop quantitative element budgets for replicated ecosystems. These results provided insight into the function of natural ecosystems and helped focus future lines of research. It was agreed that slow growth would be more manageable and would allow for interaction among all senior investigators, ensuring proper coordination and development of the overall study. Research problems that were timely and particularly pertinent to the overall research goals of the study were identified. From the beginning, the HBES has emphasized the value of knowledge derived from cooperative research. At the same time, individual research freedom has always been encouraged among both cooperating scientists and graduate students. This policy has been largely responsible for the intellectual growth of the HBES, as well as its role as a center for undergraduate and graduate education in ecosystem science.
HBES has developed into a relatively complex matrix of projects involving a large number of scientists from diverse disciplines. Beginning in 1987, core funding for the HBES has been provided through the Long-term Ecological Research (LTER) network of the National Science Foundation. Together with support from the USDA Forest Service, the LTER program provides base funding for most monitoring activities in the HBES. Individuals or groups of researchers are supported by competitive grants to pursue a variety of specific research studies in the HBES in cooperation with the LTER program. From 1963, over 1750 publications have been produced through the HBES, providing a wealth of information on the structure, function and development of forest, stream and lake ecosystems.
For more history of Hubbard Brook Experimental Forest:
Events Leading to the Establishment of the HBEF, written by Jim Hornbeck, May 2001 (pdf)
Conceptual Background
The mission of the Hubbard Brook Ecosystem Study is to improve understanding of the response of northern forest ecosystems to natural and anthropogenic disturbances. In the overall conceptual model underlying the Study (Figure 2), three types of disturbances - changing atmospheric chemistry, climate, and biota - drive changes in the interacting components of the ecosystem, including vegetation, biogeochemistry, hydrology, and food webs. These changes play out on a template that includes the biogeophysical characteristics of the landscape. The ecosystem responses may feedback to modify the template and alter biotic change. The template and the functional responses change through time in response to the disturbances and internal drivers.
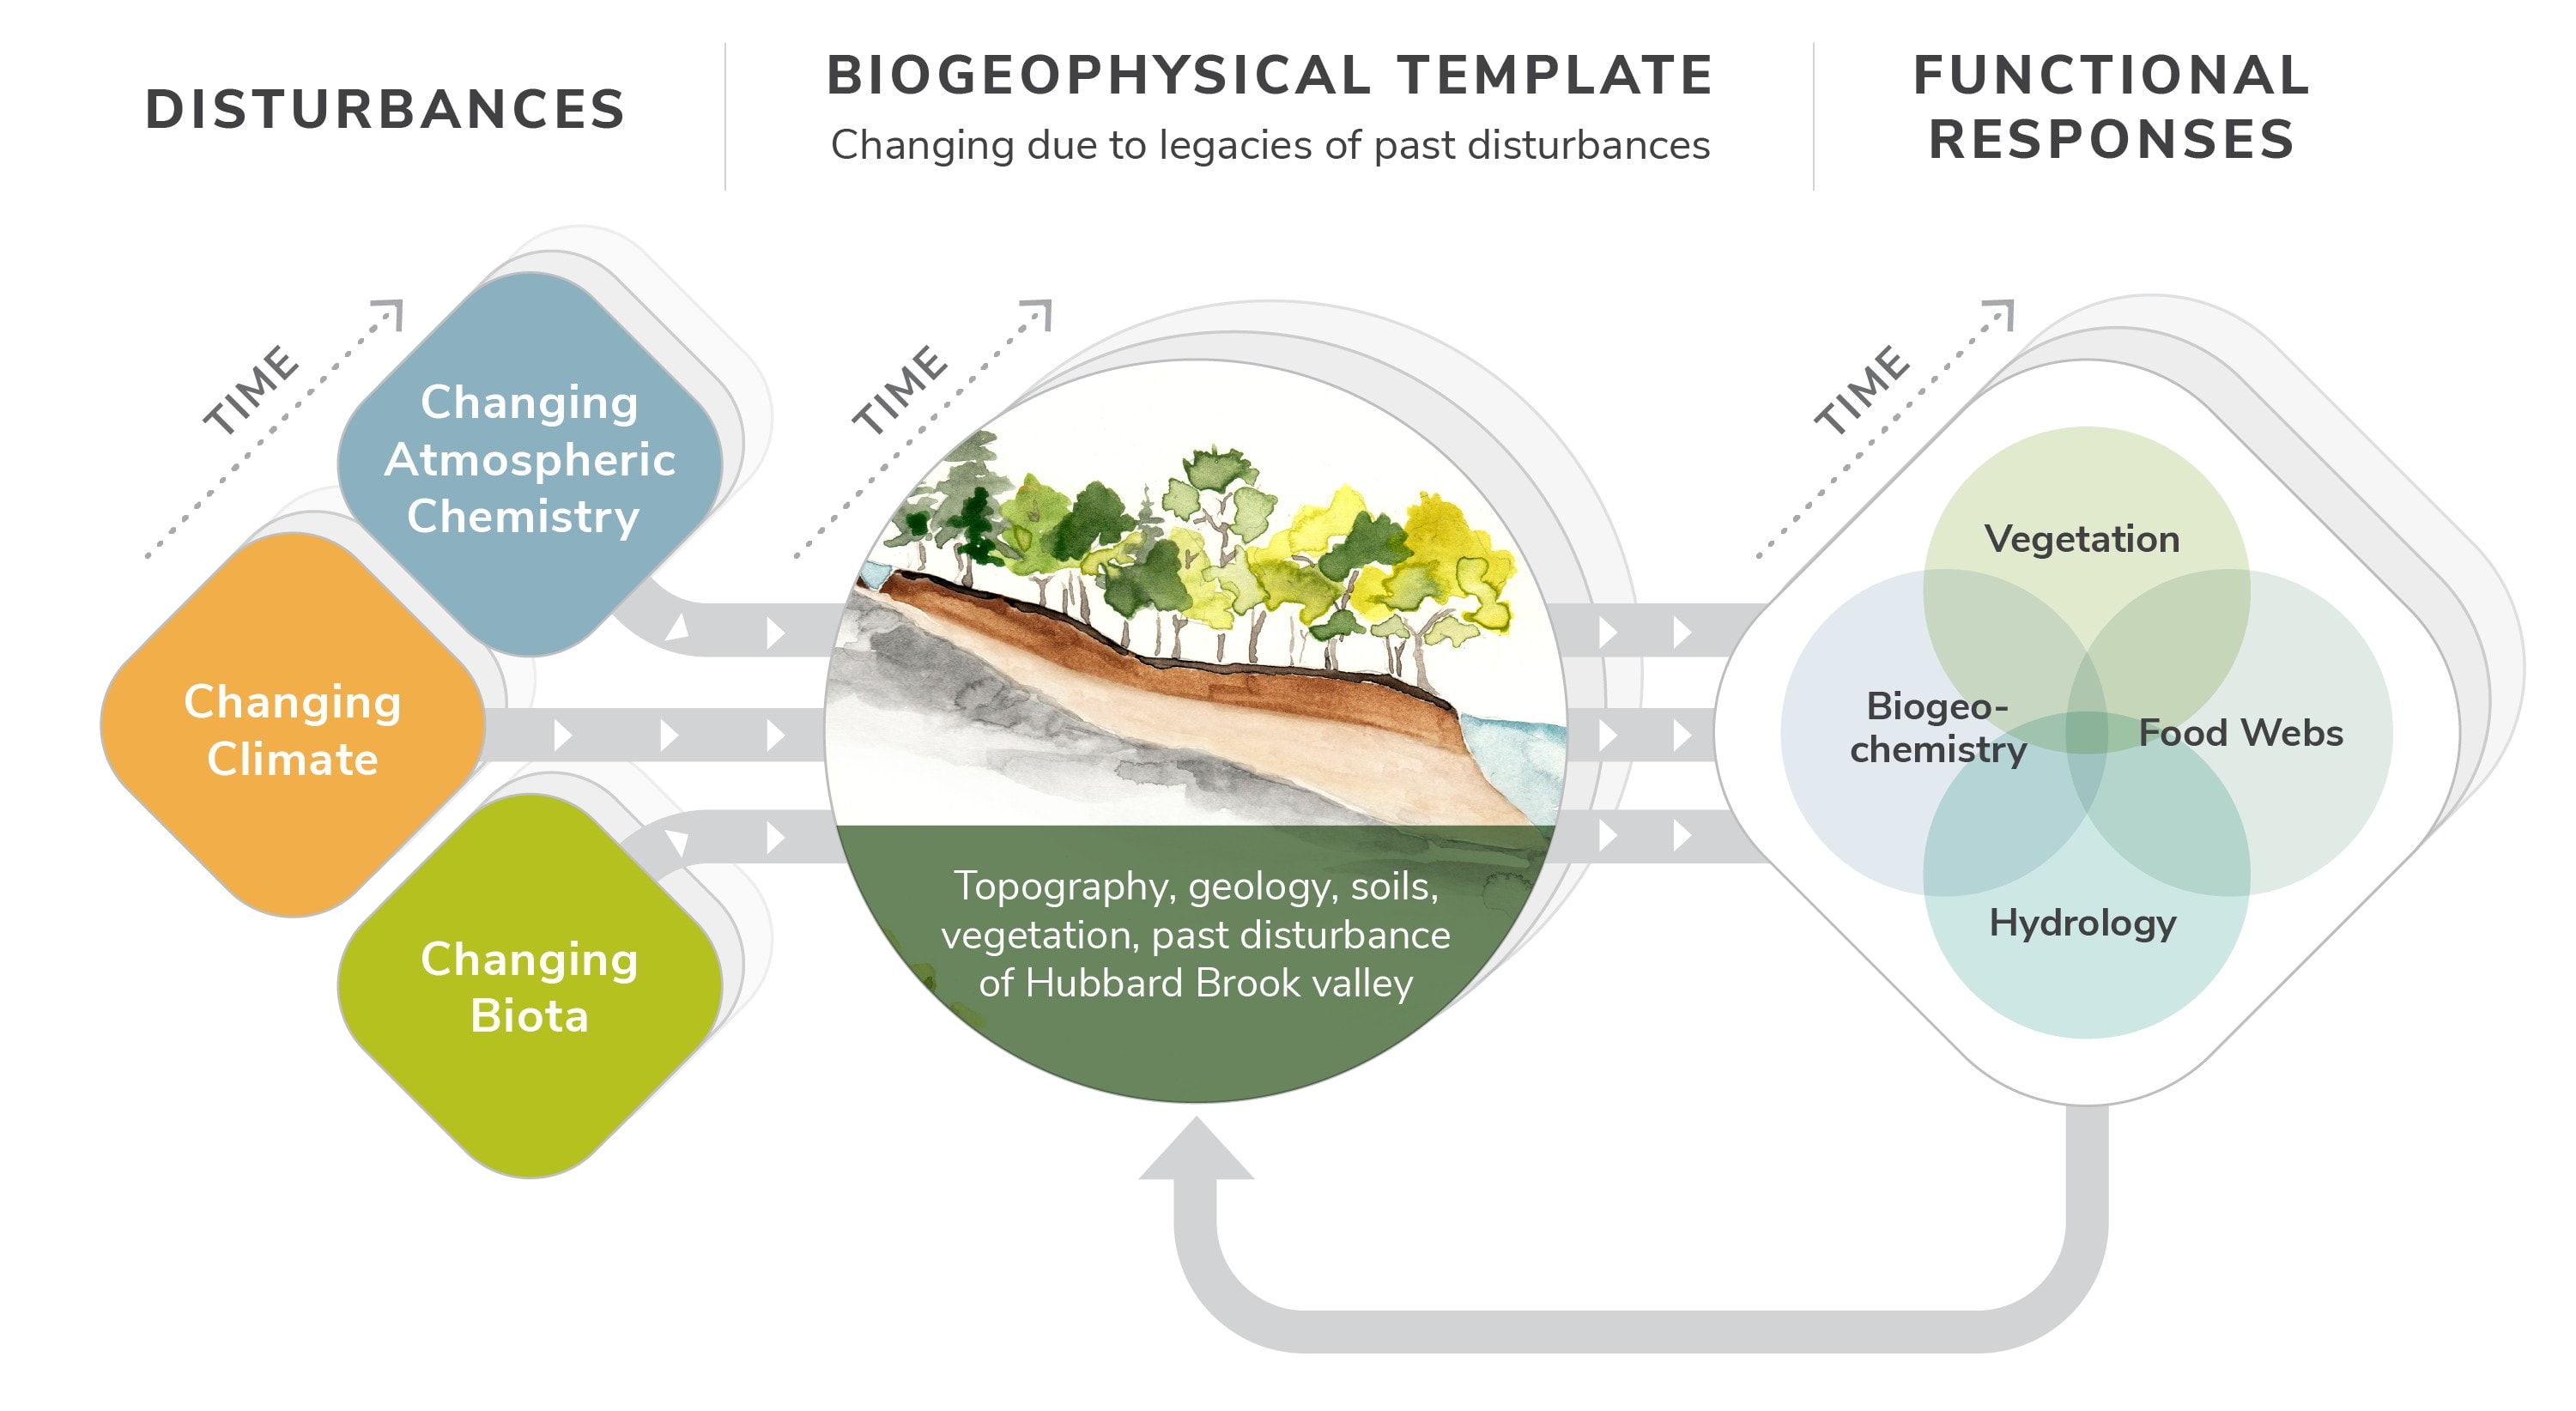
Figure 2. Conceptual model underlying the Hubbard Brook Ecosystem Study
In Figure 3 we illustrate measured and hypothesized changes in ecosystem concentrations and fluxes in response to long-term decreases in S and N atmospheric deposition and increases in CO2 concentrations. Up and down arrows indicate increases and decreases. Gold arrows reflect measured changes, purple arrows show hypothesized changes. Gray arrows indicate major ecosystem processes driving other responses in the ecosystem. We have observed increases in soil pH and base saturation in response to declining S and N deposition and expect these changes to increase soil P availability. We have also observed increases in soil microbial biomass, decreases in forest floor organic matter stocks, and shifts in solution N losses from inorganic to organic forms. We hypothesize that rising atmospheric CO2 contributes to these changes by stimulating plant CO2 uptake and nutrient demand for growth, which in turn drives an increase in plant N and P uptake from solution, increased nutrient resorption from litter and decreased litter C/N ratios, as well as increases in allocation of plant C belowground to spur organic matter mineralization and soil respiration.
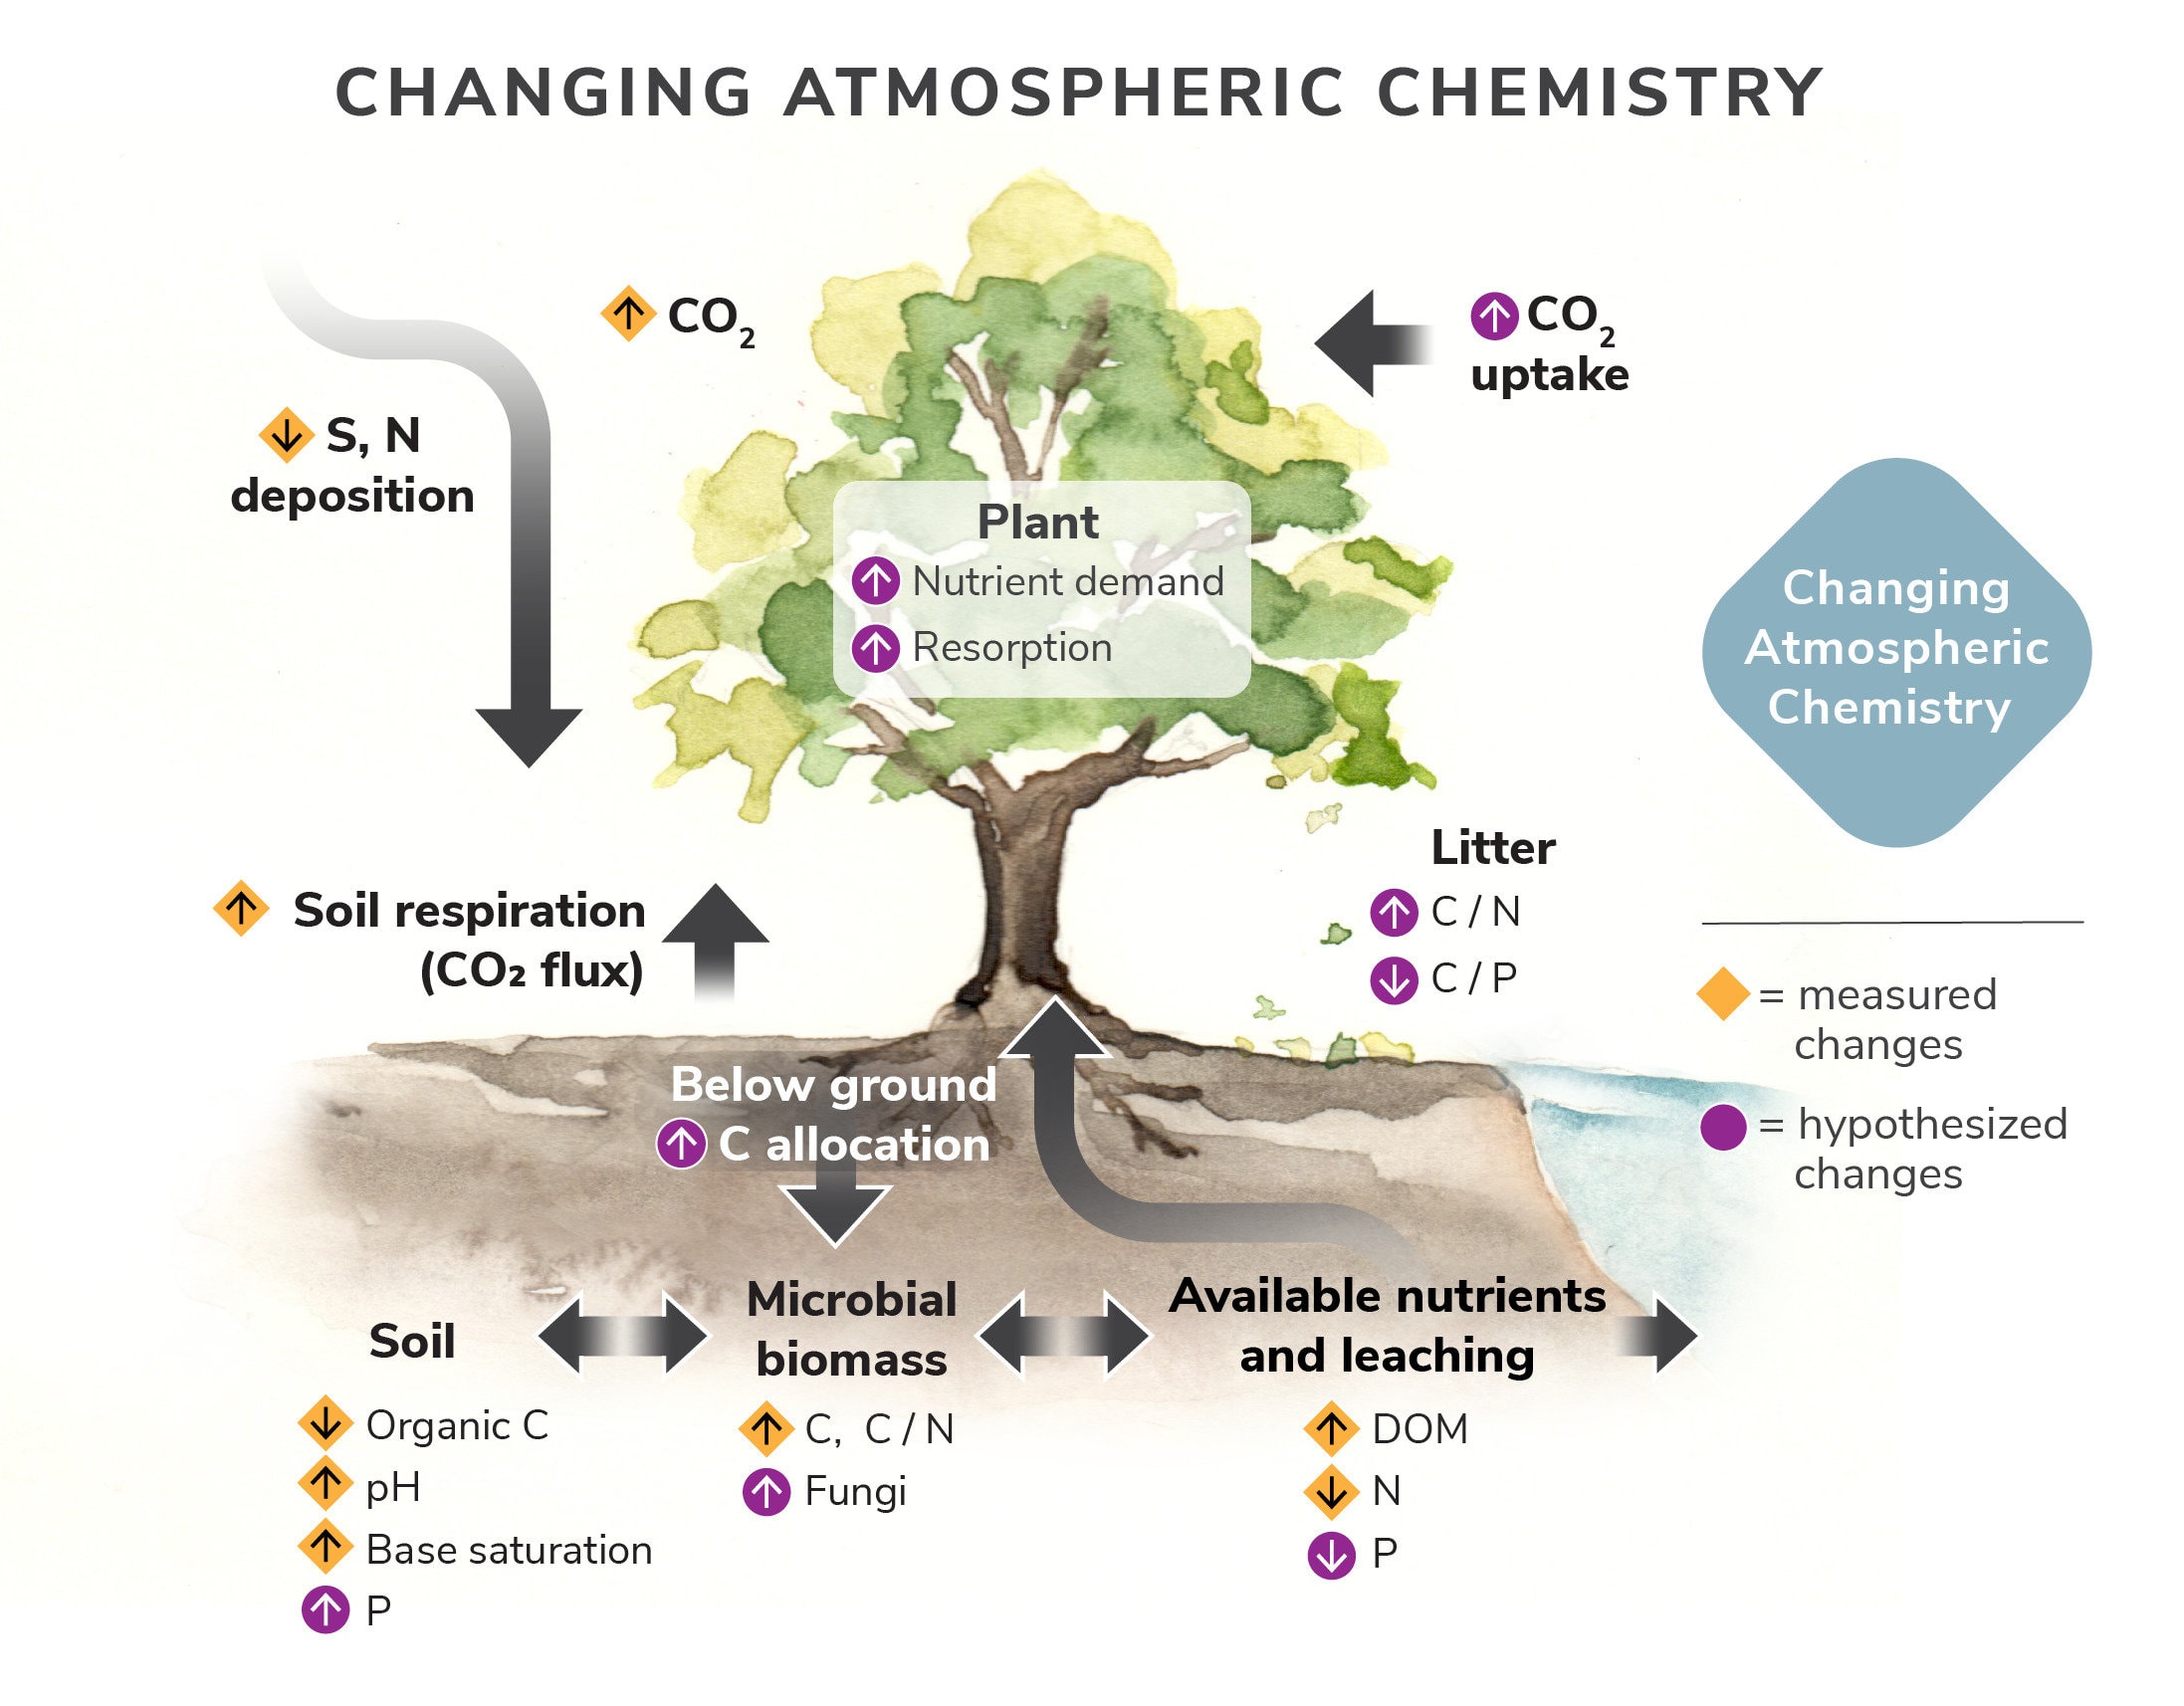
Figure 3. Illustration of measured and hypothesized changes in ecosystem concentrations and fluxes in response to long-term decreases in S and N atmospheric deposition and increases in CO2 concentrations.
Climate change disturbance has myriad effects on forest ecosystem dynamics. Here we highlight (Figure 4) a conceptual framework for diagnosing the cause of the recent observed increase in rates of evapotranspiration (ET) at Hubbard Brook (see Hydrology Chapter). We are investigating how atmospheric conditions and vegetation interact nonlinearly to affect ET. Orange arrows indicate observed trends in the long-term data. Question marks show where there is uncertainty in our understanding. The green arrow shows how the coupling of canopy and aerodynamic resistance affects rates of evapotranspiration.
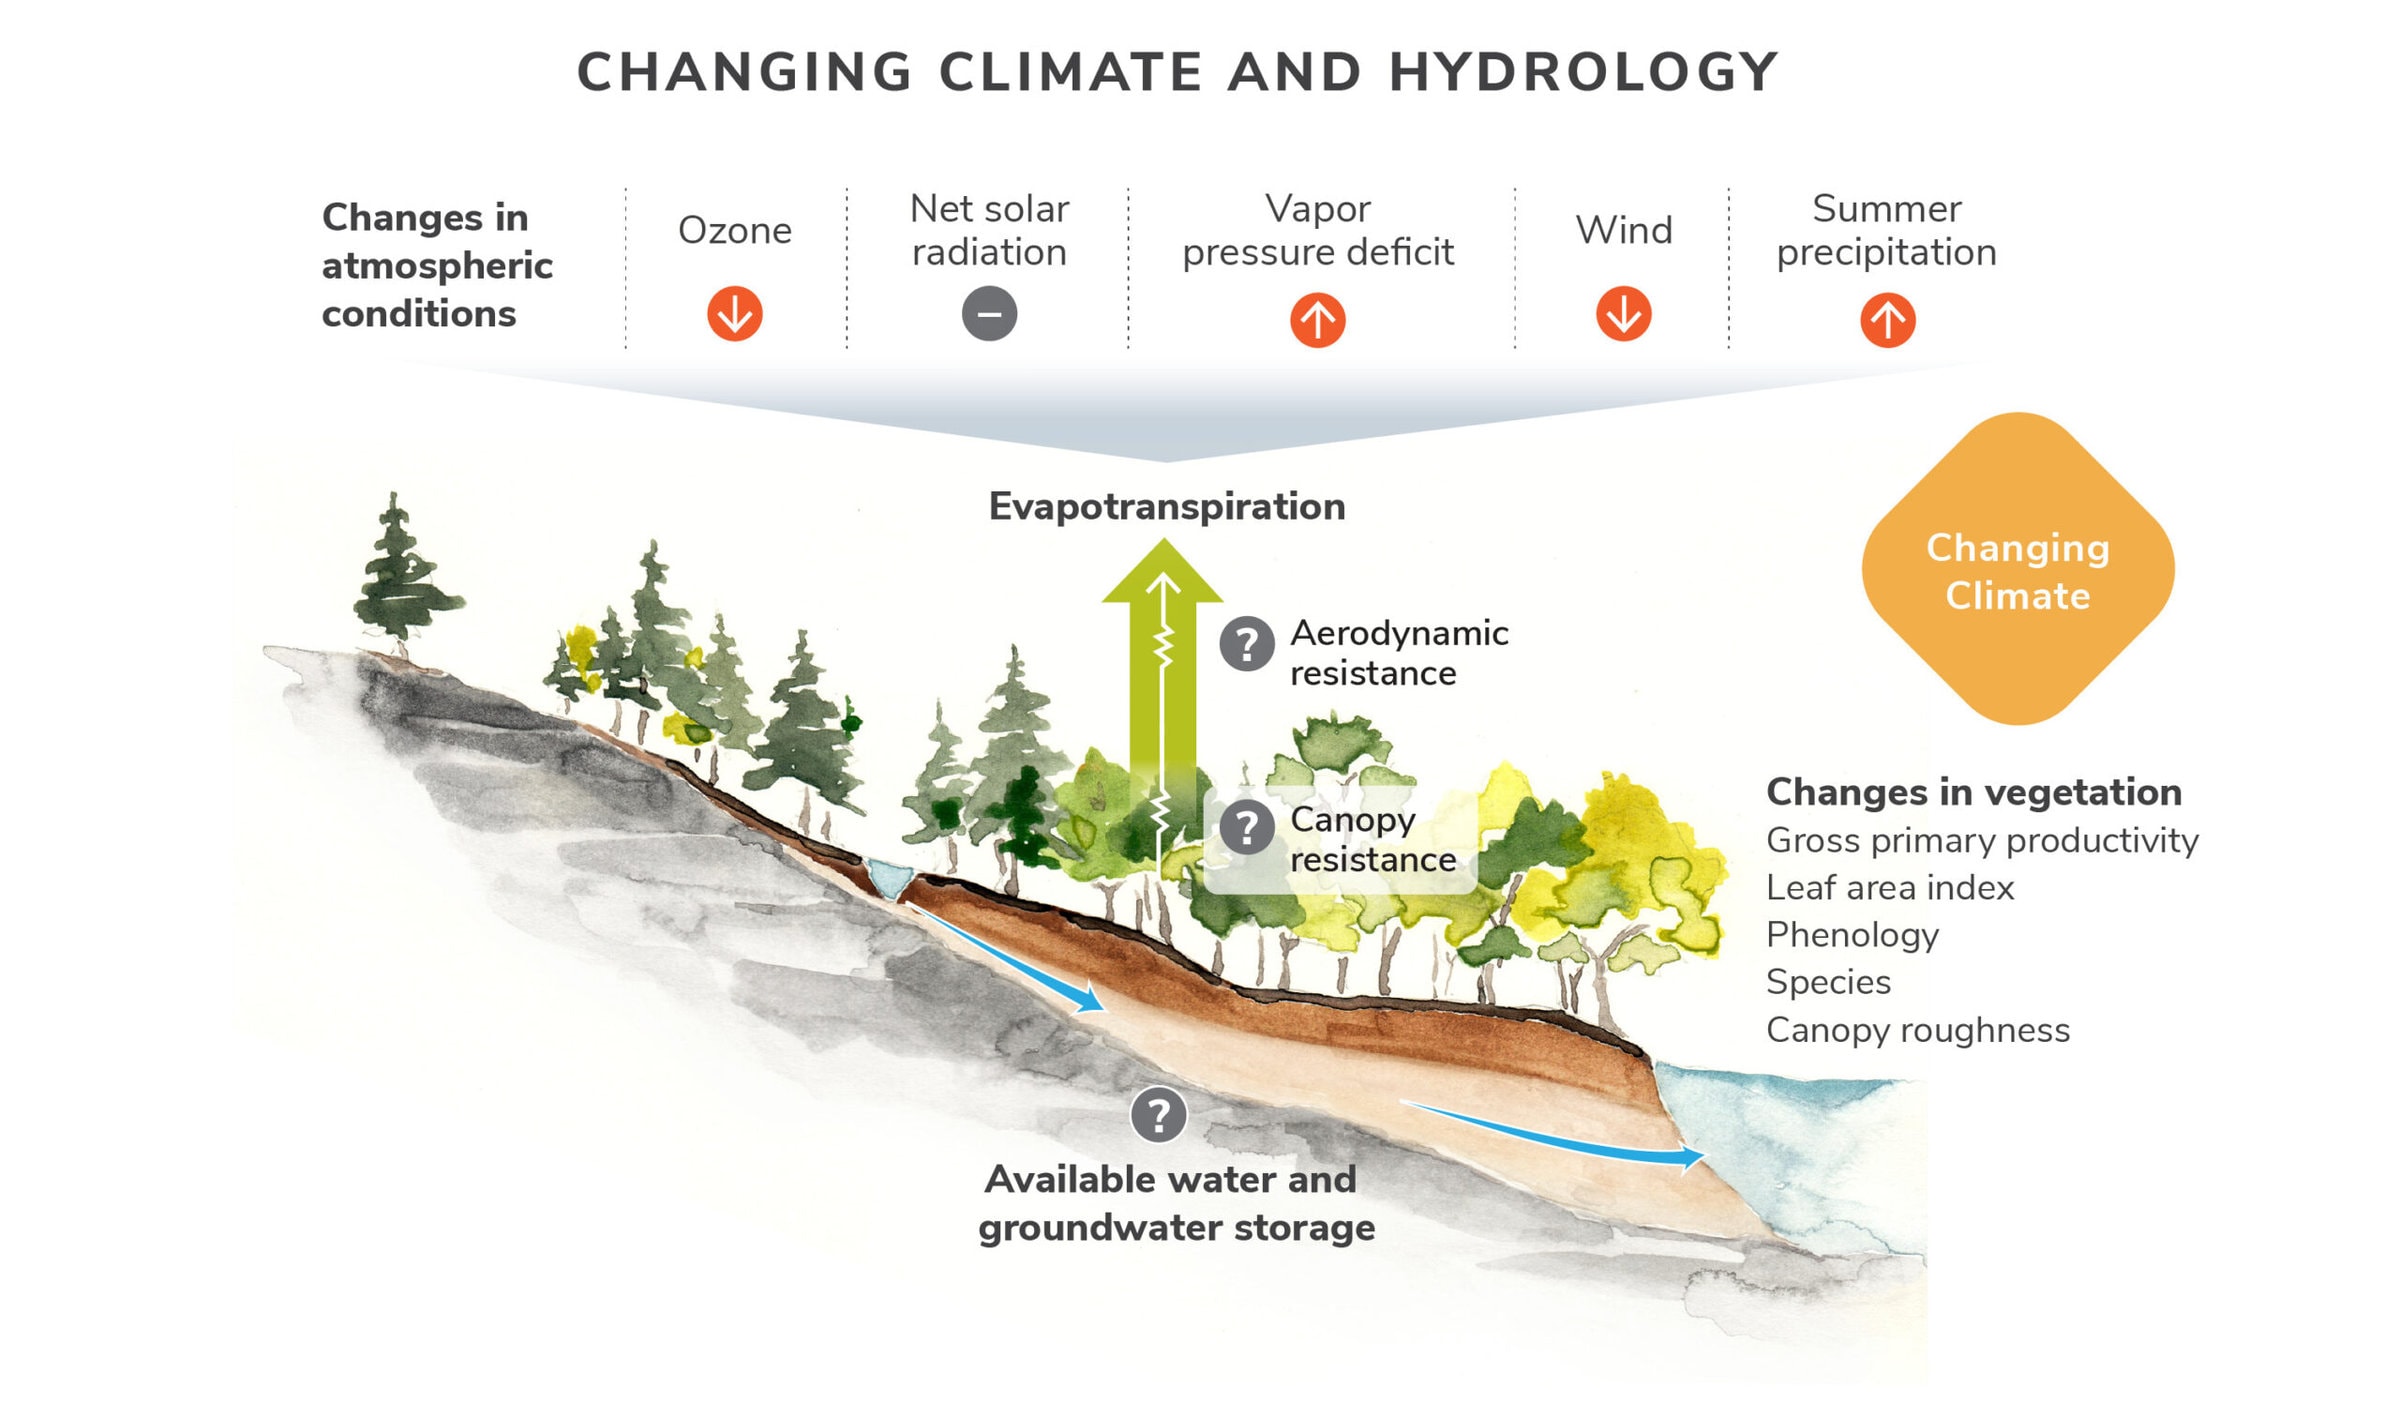
Figure 4. A conceptual framework for diagnosing the cause of the recent observed increase in rates of evapotranspiration (ET) at Hubbard Brook.
Our conceptual model of the hierarchical response of ecosystem function to chronic stressors and episodic events is illustrated in Figure 5). (A) Initial responses to stress trigger species-specific responses with limited system-wide impact. (B) With continued exposure, species abundances begin to re-order, resulting in reduced ecosystem function. (C) This slow loss of function can be accelerated by an (D) episodic disturbance. (E) If the stress persists, further changes in the biota are expected. These disturbance-driven shifts in biodiversity will have profound consequences on species additions and losses, species demography and evolution, and energy flow (inset).
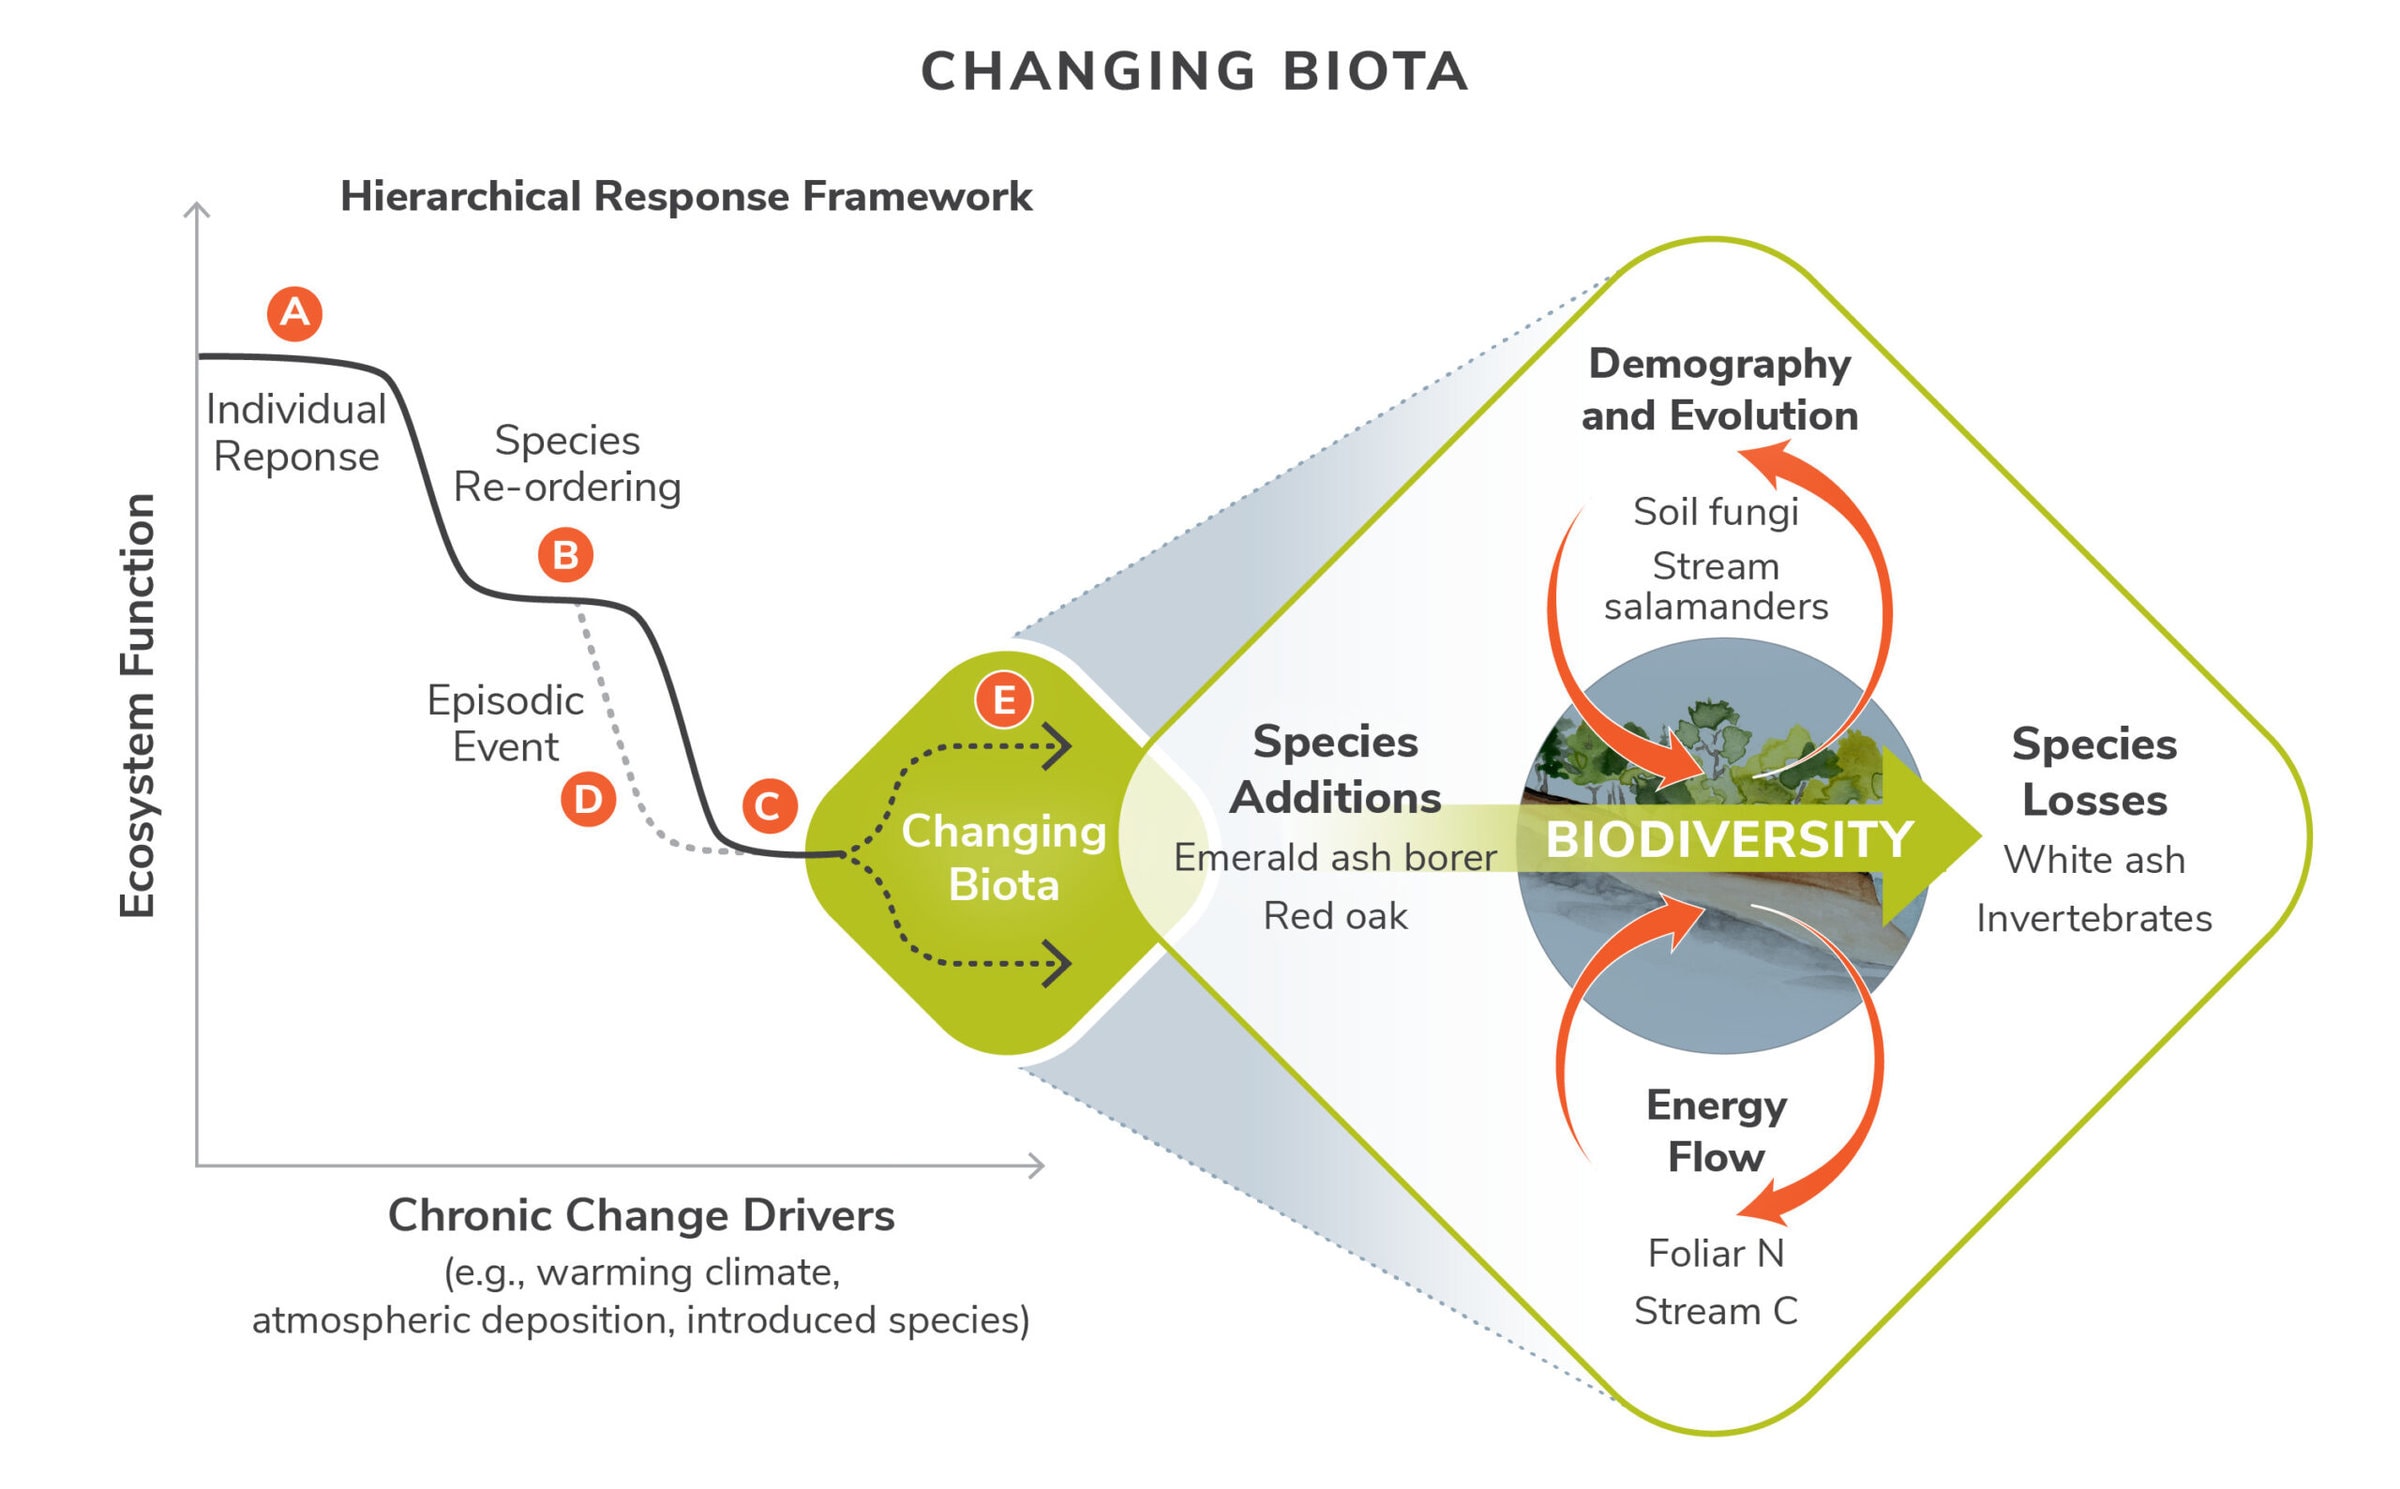
Figure 5. The conceptual model of the hierarchical response of ecosystem function to chronic stressors and episodic events
Our conceptual model of the biogeophysical template on an idealized hillslope (Figure 6) shows five slope positions along a depth-to-bedrock gradient that results in predictable variation in soils, shallow groundwater movement, and saturation frequency. Hydro-bio-pedo interactions along these soil-slope variations structure vegetation and other biota, form linkages with temporary and perennial streams, and shape the complex functional responses of ecosystem components (Figure 2).
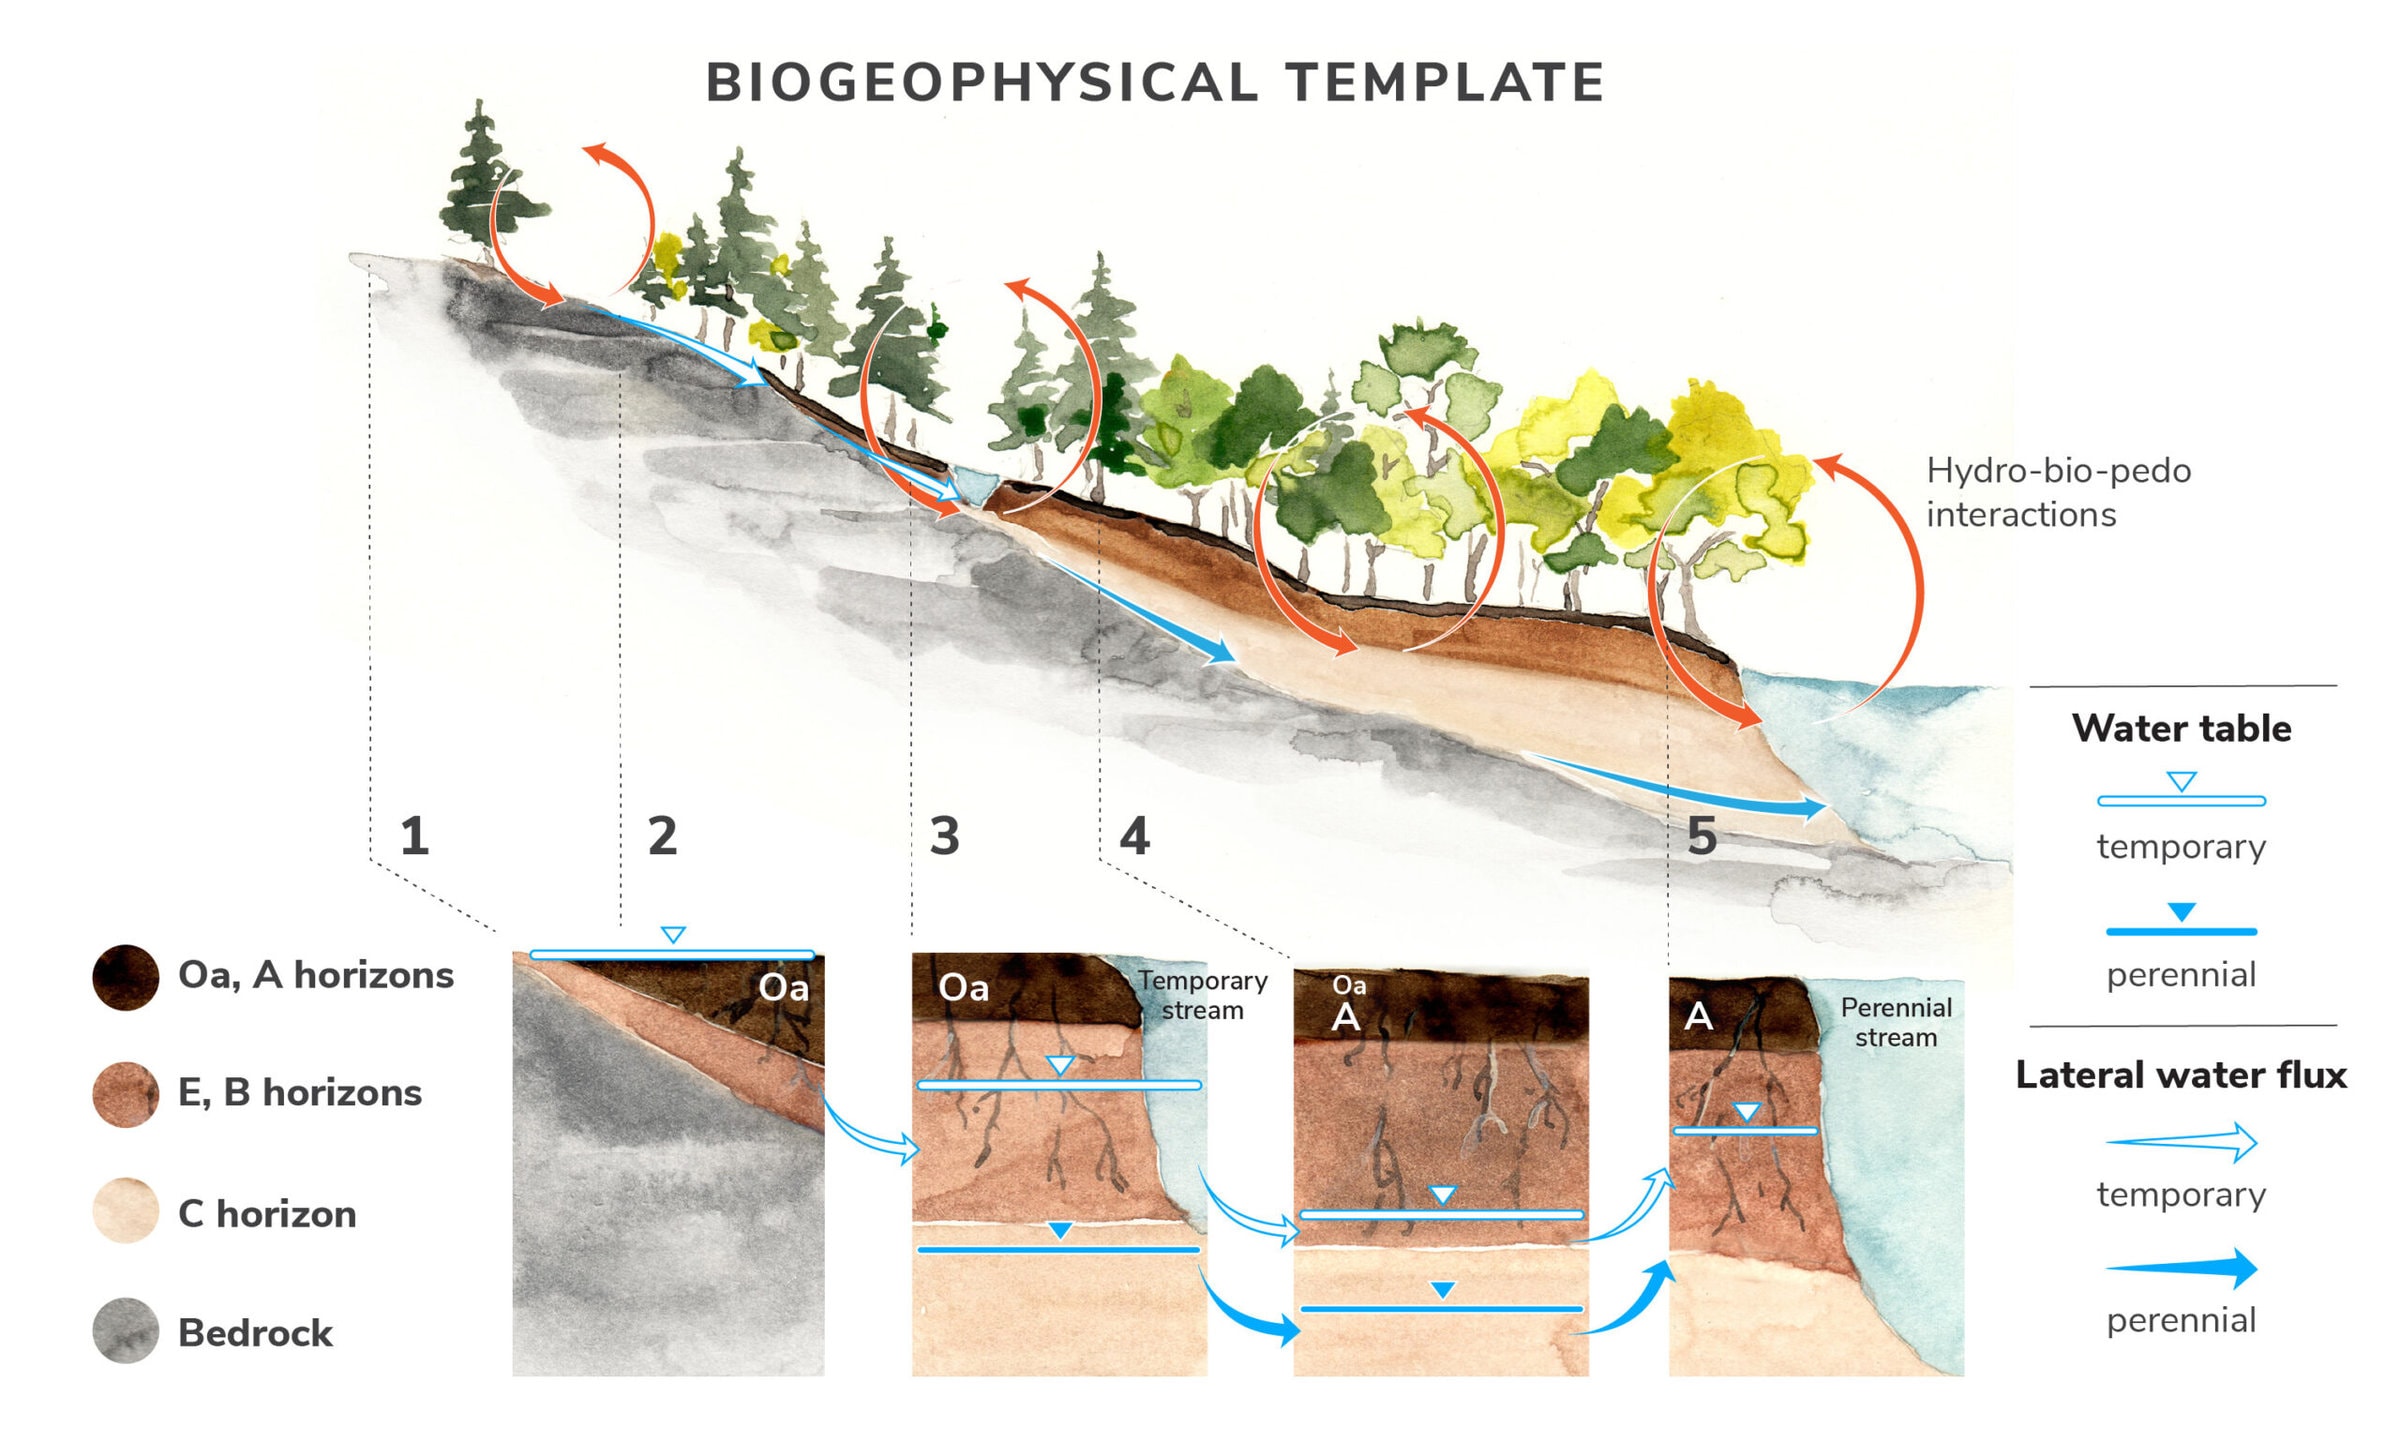
Figure 6. The conceptual model of the biogeophysical template on an idealized hillslope.
Research Approaches
The framework for the HBES is the small watershed approach which provides precise quantitative water and element input-output budgets for the forested ecosystems. In a catchment where the underlying bedrock is impermeable, water falling on the catchment leaves only by evapotranspiration (ET) or as stream discharge. By quantifying the latter, annual ET can be calculated by difference:
Eq. 1. AET = Precipitation – stream discharge
For chemical elements without a gas phase at Earth temperature, the small watershed also allows estimation of soil weathering (Johnson et al. 1981):
Eq. 2. Weathering = stream output – atmospheric input + ∆ storage
Here, the stream output and atmospheric input of an element are determined as the product of water flux and the element concentration in the water. The ∆ storage term refers to any change in the stock or pool of an element in the soil organic matter or vegetation biomass in the ecosystem. For example, when vegetation biomass is aggrading some of the chemicals weathered from soil minerals are accumulating in the trees rather than lost in stream discharge and the ∆ storage term is positive in Equation 2. Also, some elements enter the ecosystems as dry rather than wet deposition (e.g. dust particles), and this flux is included in the atmospheric input term.
For elements with gaseous phases (e.g., N, C), separate measurements of gas fluxes in and out of the ecosystem are needed to estimate material budgets (see below). Experimental manipulations (e.g., forest harvest, fertilization) can be applied at the small watershed scale to quantify whole ecosystem responses (Bormann et al. 1974). The internal processes determining the whole ecosystem responses are measured at the plot scale at selected locations within or nearby the small watershed. Together these measurements form the basis for much of the research in the HBES including long-term monitoring as detailed below.
Atmospheric Inputs
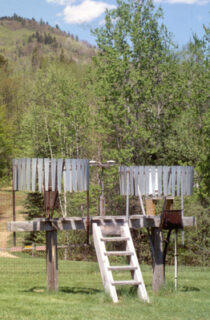
Figure 7. Atmospheric deposition collectors at Hubbard Brook.
Atmospheric deposition of elements to the ecosystem is the sum of wet and dry deposition. Measurement of wet deposition has been conducted on a weekly basis since 1963 at a network of sampling sites across the HBEF (Figure 7). All major dissolved solutes are measured and together with precipitation water volume from standard rain gauges, element fluxes in wet deposition are determined.
Dry deposition of particles and gases is more difficult to quantify than wet deposition and can constitute a substantial proportion of the input of several important elements, especially nitrogen and sulfur, that are derived partly from pollutant emissions. Some of the dry deposition can be captured on artificial samplers or as canopy throughfall, but the calculation of dry deposition flux is complex and uncertain, and we refer the reader to detailed explanations in the literature (Likens et al. 2002).
Stream Output
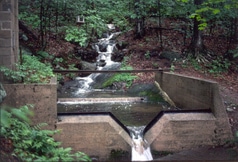
Figure 8. Photograph of a V-notch weir at Hubbard Brook.
Stream discharge of water from nine small watersheds in the HBEF is measured continuously with 90o or 120o V-notch weirs located at the base of the surveyed catchments (Figure 8.). The weirs continuously measure stage height in a stilling pond above the weir outlet. Each weir is calibrated by directly measuring the relationship between stage height and water flux. To calculate element fluxes, water samples for chemical analysis are collected weekly just above each weir. More frequent measurements to more precisely quantify storm-event fluxes have been conducted periodically using automated samplers. Flux of particulate matter is measured by removing accumulated material in the weir stilling pond periodically. The flux of fine suspended solids during large storm events also has been measured using permeable bags positioned below the weir.
Forest Vegetation
The composition, biomass and element content of the vegetation is measured periodically within the gauged watersheds and throughout the entire HBEF. The basic approach is to measure the diameter of trees across the whole watershed (e.g., WS6, WS1) or in smaller plots usually at five-year intervals. Forest biomass is estimated using allometric equations relating DBH to other tree dimensions (e.g. total biomass and biomass of tissue components like leaves, branches, etc.). These equations were developed at the site by directly measuring trees harvested during experimental manipulations (Whittaker et al. 1974, Siccama et al. 1994). The pool or stock of an element is estimated from the product of mass and element concentration in various tissues. Thus, changes in the stock of an element in the forest biomass are calculated typically at a 5-year intervals.
Soils
The mass and element stocks of soils have been estimated using the quantitative pit approach. The soil is carefully excavated manually from a 0.5 m2 area through depth increments to the C horizon. Soil mass in each depth increment is weighed and sieved in the field and subsamples are taken for chemical analysis in the laboratory. Because of the large stocks and high spatial variability of elements in soil, detection of changes through time or in response to treatments is challenging. Nevertheless, we have been able to estimate the net soil release for major elements resulting from acid deposition and forest harvest on the basis of quantitative pit sampling (Johnson et al. 1991).
Gaseous Output
The small watershed approach does not, by itself, account for outputs in gas phase, an important flux pathways for the nutrient element nitrogen. Gaseous flux of N remains a key uncertainty in the N budget at the HBEF (Yanai et al. 2013). The principal gaseous flux of N results from denitrification, a process that is notoriously variable in space and time. The flux chamber approach, in which the accumulation of gaseous N diffusing from soil is measured over short time intervals (e.g. minutes), is applied routinely to estimate flux of nitrous oxide in several plots in and around the experimental watersheds at the HBEF. Unfortunately, because of the high background in the atmosphere this approach is not effective for measuring N2 flux. Laboratory, isotopic and modeling approaches have provided indirect estimates of N2 flux from soils (e.g., Wexler et al. 2014).
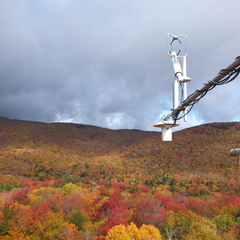
Figure 9. Photograph of flux tower instrumentation at Hubbard Brook.
Fluxes of carbon dioxide and water vapor from the forest ecosystem can be estimated using aerodynamic approaches with eddy flux towers. Recently, an eddy flux tower has been installed in the lower valley at the HBEF and began collecting data in 2016 (Figure 9). The facility will soon provide the first direct estimates of gross primary production, autotrophic and total ecosystem respiration, and net ecosystem productivity for the forest in the footprint of the tower.
Internal Element Fluxes
The processes regulating the biogeochemistry of the forest ecosystem include a variety of major internal element fluxes which are monitored in selected intensive plot locations in and around the experimental watersheds at the HBEF. In particular, element leaching through soils is measured using zero-tension lysimeters positioned beneath the forest floor, Bh and Bs horizons. Water fluxes at each depth, estimated with a hydrologic model, are used with measured element concentrations in soil solutions to estimate soil leaching fluxes (Cho et al. 2010).
Litterfall is measured using permanent litter traps co-located in plots with soil lysimeters. Litter is sorted by species, providing annual estimates of leaf biomass and leaf area index in these plots. Periodically, the chemistry of leaf litter is measured; combined with chemistry of live foliage from the plots, these measurements provide estimates of nutrient resorption from senescing foliage, a large internal ecosystem flux especially for N and P (Ryan and Bormann 1982). Deposition of woody litter as coarse woody debris is measured annually on cleared 2.5 m2 plots co-located with litter traps. The chemistry of canopy throughfall and element fluxes in canopy leaching also have been measured in these intensive plots (Lovett et al. 1996) as well as the biomass, chemistry and turnover of fine and coarse roots, using coring and rhizotron methods, so that a comprehensive accounting of the principal internal element fluxes is available for the forest ecosystems in the experimental watersheds.
References
Bormann, F. H., G. E. Likens, T. G. Siccama, R. S. Pierce and J. S. Eaton. 1974. The export of nutrients and recovery of stable conditions following deforestation at Hubbard Brook. Ecological Monographs 44(3):255-277.
Cho, Y., C. T. Driscoll, C. E. Johnson, and T. G. Siccama. 2010. Chemical Changes in Soil and Soil Solution After Calcium Silicate Addition to a Northern Hardwood Forest. Biogeochemistry 100(103). doi:10.1007/s10533-009-9397-6.
Fahey, T. J., P. H. Templer, B. T. Anderson, J. J. Battles, J. L. Campbell, C. T. Driscoll, A. R. Fusco, M. B. Green, K. A. S. Kassam, N. L. Rodenhouse and L. Rustad. 2015. The promise and peril of intensive site based ecological research: insights from the Hubbard Brook ecosystem study. Ecology, 96(4):885-901. doi:10.1890/14-1043.1
Johnson, C. E., A. H. Johnson, T. G. Huntington and T. G. Siccama. 1991. Whole-tree clear-cutting effects on soil horizons and organic-matter pools. Soil Science Society of America Journal 55:497-502.
Johnson, N. M., C. T. Driscoll, J. S. Eaton, G. E. Likens and W. H. McDowell. 1981. Acid rain, dissolved aluminum and chemical weathering at the Hubbard Brook Experimental Forest, New Hampshire. Geochimica et Cosmochimica Acta 45(9):1421-1437.
Likens, G. E., C. T. Driscoll, D. C. Buso, M. J. Mitchell, G. M. Lovett, S. W. Bailey, T. G. Siccama, W. A. Reiners and C. Alewell. 2002. The biogeochemistry of sulfur at Hubbard Brook. Biogeochemistry 60(3):235-316.
Lovett, G. M., S. S. Nolan, C. T. Driscoll and T. J. Fahey. 1996. Factors regulating throughfall flux in a New Hampshire forested landscape. Canadian Journal of Forest Research 26:2134-2144.
Ryan, D. F. and F. H. Bormann. 1982. Nutrient resorption in northern hardwood forests. BioScience 32(1):29-32.
Siccama, T. G., S. P. Hamburg, M. A. Arthur, R. D. Yanai, F. H. Bormann and G. E. Likens. 1994. Corrections to allometric equations and plant tissue chemistry for Hubbard Brook Experimental Forest. Ecology 75(1):246-248.
Wexler, S. K., C. L. Goodale, K. J. McGuire, S. W. Bailey, and P. M. Groffman. 2014. Isotopic Signals of Summer Denitrification in a Northern Hardwood Forested Catchment. Proceedings of the National Academy of Sciences 111(46): 16413-16418 doi:10.1073/pnas.1404321111
Whittaker, R. H., F. H. Bormann, G. E. Likens and T. G. Siccama. 1974. The Hubbard Brook Ecosystem Study: forest biomass and production. Ecological Monographs 44(2):233-254.
Yanai, R. D., M. A. Vadeboncoeur, S. P. Hamburg, M. A. Arthur, C. B. Fuss, P. M. Groffman, T. G. Siccama, and C. T. Driscoll. 2013. From Missing Source to Missing Sink: Long-Term Changes in the Nitrogen Budget of a Northern Hardwood Forest. Environmental Science and Technology 47(20): 11440-11448 doi:10.1021/es402572


