Chapter Editors: Nat Cleavitt and Tim Fahey
Introduction
American beech (Fagus grandifolia L) is a foundational tree species in deciduous forests of eastern North America, commonly co-dominating in mature forest stands with sugar maple, eastern hemlock, and other species. As a highly shade tolerant species, beech is maintained as a dominant species in the shifting-mosaic, steady-state northern hardwood forest. Beech plays a key functional role in these forests, including serving as a key food source for mammals with its large, energy-rich seeds. Hence, beech seed masting (see Forest Composition Chapter) can act as a bottom-up control on the grazer food web. The dynamics of beech populations depend upon both its pulsed seed reproduction as well as its exceptional ability to root sprout; the proportion of beech stems derived from genets and ramets can vary considerably among populations for reasons that are imperfectly understood. However, management regimes and terrain where root injury is frequent tend to have more sprout origin stems. At Hubbard Brook and throughout its range beech is currently suffering from a suite of stresses that will undoubtedly affect its abundance across the region in coming decades, including beech bark disease, heat-drought, beech leaf disease and competitive interactions. Research at the HBEF is providing insights into the underlying mechanisms of these environmental and biotic stresses on beech.
Beech bark disease
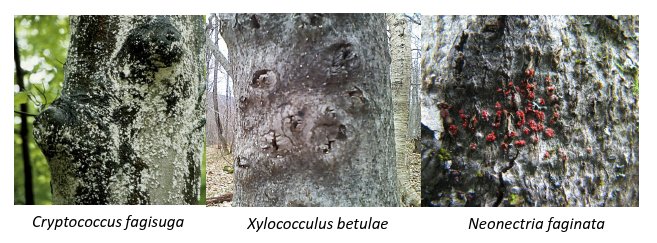
Figure 1. The primary organisms involved in the beech bark disease complex as manifested in Hubbard brook Experimental Forest. The exotic scale insect is evident by white waxy excretions (left), the native scale insect makes raised cankers (middle) and the fungus is evident when the fruiting bodies emerge (right).
This disease is a complex interaction between a non-native scale insect (Cryptococcus fagisuga) that originated from Asia and native pathogenic fungi, particularly Neonectria faginata (Figure 1). The scale insect opens the naturally smooth bark of the American beech to infection by the canker fungi. Other organisms involved in beech bark disease on some sites are another scale insect, Xylococculus betulae, and another fungus, Neonectria ditissima. At Hubbard Brook, both scale insects and the fungus, N. faginata, appear to dominate the disease complex (Cleavitt et al. 2022). The canker fungus invades the tree cambium and the cankers are a means of the tree building up tissue around the infections. Even as the tree expends energy fighting these attacks on its cambium, some of the vascular tissue is compromised and limbs in the canopy that were fed by these damaged vascular tissues die. The disease can take decades to actually kill a tree (Cale & McNulty 2018; Cleavitt et al. 2021) and more often contributes to death by weakening the tree and making it more susceptible to other stresses such as wind breakage, insect defoliation and drought.
To date, BBD has invaded about one-third of the North American regions where beech is present and within these regions BBD affects most beech in stands where this tree dominates (Garnas et al. 2011; Cale et al. 2017). Disease severity of BBD is influenced by a complex suite of factors operating at various temporal and spatial scales. Time since infection is the critical temporal factor (Garnas et al. 2011). At the individual tree-scale, factors known to influence BBD severity include tree size, vigor, canopy position and innate genetic resistance (Evans et al. 2005; Cale et al. 2017). At the landscape-scale, BBD severity varies with slope, aspect, and elevation but the influence of these landscape features on disease progression is inconsistent (Evans et al. 2005; Griffin et al. 2003; Mulder et al. 2020).
Shigo (1972) and Houston (1994) have described temporal models of disease development that relate forest-scale effects of the BBD: (1) the advance front, where some scale insects are found but signs of canker fungi are absent, (2) the killing front, where both agents of the BBD complex are present and widespread mortality of beech is apparent, and (3) the aftermath forest, where a few resistant beech persist alongside trees exhibiting all degrees of injury, and the size distribution is altered such that thickets of small trees of seedling and sprout origin have replaced many of the larger trees (Shigo 1972; Houston 1975). Houston studied BBD in the forests of Maine, where the disease first entered from the Canadian maritime (Houston 1975). A few decades later Houston (1994) observed additional changes beyond the aftermath stage. Houston considered the advance and killing fronts, wherein the establishment and buildup of the causal factors result in high beech mortality, as the first phase of the disease. His second phase is the aftermath stage, where damage from endemic pathogens accrues and a shift in size and age distribution occurs. The third phase, termed the “phase of accommodation” is observed in long-affected stands that experience little new disturbance and is generally a syndrome of poor vigor and slow growth (Houston 1994).
BBD at Hubbard Brook
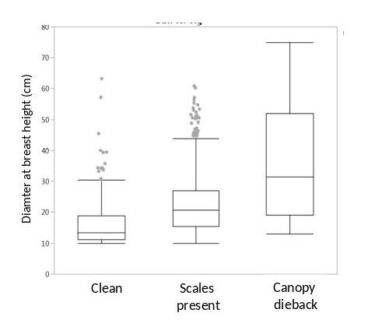
Figure 2. The tree diameter distribution for three classes of beech trees rated on Watershed 6, the reference watershed at Hubbard brook, by Tom Siccama in 1977 (unpublished data). The boxes show the median, 50% (box), 95% (error bars) and outliers (dots) for the tree measures.
Tom Siccama made careful observations of the arrival of the scale insect in the HB valley and the amount of canopy die back in the beech trees. His best guess for the arrival of BBD was the early 1970s. The first quantification was during the W6 tree survey in 1977, when Tom scored the beeches as healthy (58%), scale insect present (31%) or with canopy die back (3%). The remaining 8% of beeches were unhealthy or standing dead, but not necessarily from BBD. As is typical of BBD impact, the health of larger trees is impacted more than smaller trees (Figure 2).
For subsequent surveys, to better capture gradients in disease presence, a disease severity rating system using a five-point scale has been applied (similar to Rhoads et al. 2002; see Figure 3): 0- tree clean of both scales and cankers; 1- scale present but no signs of fungal infection; 2-cankers (often from Xylococculus betulae) present but not widespread (cankers discrete and not more than four around the bole of the tree); 3- cankers present and widespread (cankers often touching and more than three around the stem of the tree); 4- cankering coalesced and the outline of the tree completely disfigured. Here, we define the ratings of 3 and 4 to represent the “severe” BBD. Recent ongoing student work on our rating system has uncovered the correspondence of severe Xylococculus cankers with Neonectria presence, which appears to explain how our rating system captures severity of the disease (Harris & Cleavitt, unpubl. data).
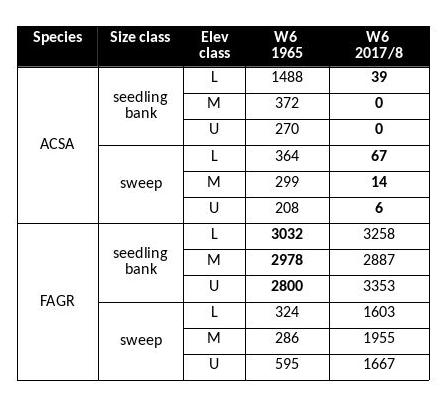
Table 1. Comparison of seedling bank (>50cm in hgt; <2cm DBH) and sweep (2-9.9 cm DBH) layers. Values are stems per hectare. 1965 data from Bormann et al. (1970). Sugar maple (ACSA) and beech (FAGR) are the main species present in the seedling bank. The elevation classes are L (lower third, 546-625m ), M (middle third, 625-709 m) and U (upper third, 709-791m).
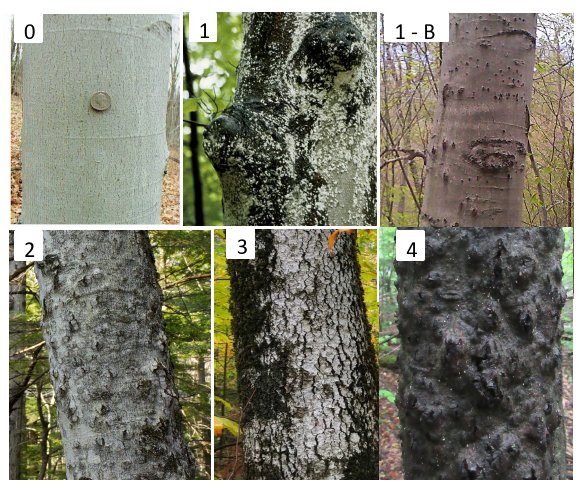
Figure 3. Current protocol for rating beech bark disease at HBEF: 0 = no signs of BBD, bark smooth; 1 = BBD present, but does not affect DBH measurement, lower bole mostly uncankered; 1-B shows BBD 1 with bumps from bear claw marks; 2 = 1-3 cankers affect DBH measurement; 3 = 3+ cankers distort DBH measurement; 4 = Cankers have coalesced and trunk is completely disfigured usually with canopy dieback.
The Hubbard Brook Forest has been significantly impacted by BBD. Beech has always been present in the understory, but density of beech in the larger sapling class has increased in recent surveys. A comparison of the beech stem densities in the seedling bank (stems taller than 5cm, but smaller than 2cm in diameter) shows comparable numbers between 1965 (the first survey) and 2017 (the most recent survey) (Table 1). However, the number of beech stems in the sapling layer is an order of magnitude greater in the most recent survey (Figure 3). This group of understory beech is now growing into the >10 cm diameter class which we tag and track on the gaged watersheds (Figure 4). From 1977 to 2017, the number of live tagged beech stems on W6 has increased by nearly 3000 stems and the average size has decreased by 3.32 cm. However, the shift in size distribution has been overwhelmingly driven by the influx of smaller stems rather than by the loss of larger stems. Neither Siccama et al. (2007) nor subsequent surveys reported the increase in beech mortality expected from a killing front and many large beech remain (Figure 4). Are there circumstances under which the typical “killing front” does not materialize or loss of larger trees is minimized?
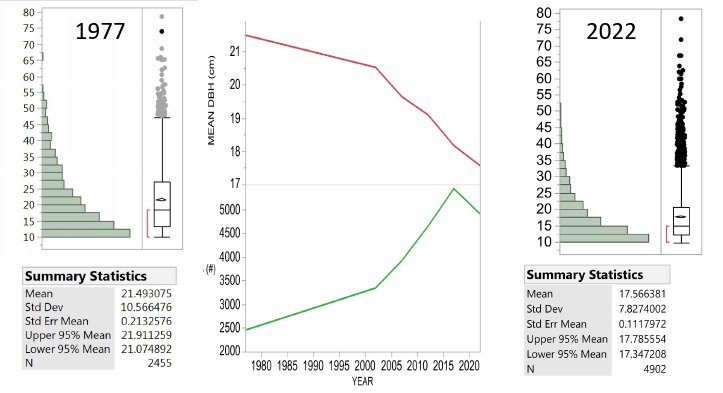
Figure 4. The tree diameter distribution for all beech trees measured on Watershed 6, the reference watershed at Hubbard brook. The first measure in 1977 was followed 25 years later in 2002 and then every 5 years. Note that the main changes are the increase in number of tagged beech and the decrease in mean DBH with the skewing of the distribution toward more small stems over time rather than the loss of the largest trees. Note the largest beech in 1977 was 78.5 cm and in 2022 the largest was 78.2 cm.
Beech Hell at the HBEF
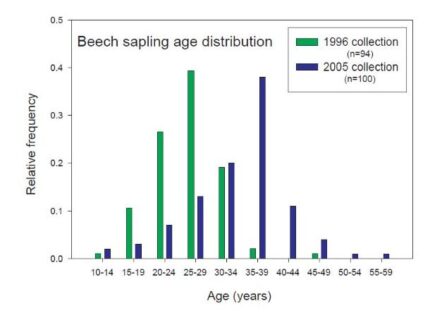
Figure 5. Beech sapling age distribution by frequency of age on Watershed 6. This graph shared by Tom Siccama in a 2005 “Dear Associates letter” that he used to share data within the HB community. Both sampling times suggest a cohort origin in the 1970-1975 timeframe. Survivors are now recruiting into tagged tree inventory accelerating shift in size distribution and density of smaller tagged beech.
A large cohort of beech (termed “beech hell” by Tom Siccama in the 1990s) has been documented with an origin in the early 1970s by analysis of a subsample of tree aging studies done by Siccama and his students in 1996 and 2005 (Figure 5). This cohort appears responsible for the increased density of smaller, young stems. The origin of the 1990s beech thicket has often been attributed to BBD (Hane 2003; Siccama et al. 2007); however, several lines of evidence suggest this may not be the case. First, the early 1970s cohort of beech appears to pre-date the impacts of BBD (remember, in 1977 on the same watershed only 3% of the canopy beech had dieback). Jones and Raynal (1986) are often cited as evidence that BBD could promote sprout production in beech; however, they actually reported: “Since much of the lowered vigor in the trees of this study was caused by beech bark disease, the disease appears to have no stimulator-effect on sprout growth or production (and possibly a negative effect on production) as long as the parent tree is alive.” In addition, they added that Held’s (1983) suggestion that soil frost could promote sprouts should be more thoroughly investigated. Other lines of evidence from Hubbard Brook include: 1) beech sprouts accounted for only 10% of the beech seedling bank in 1965 (Forcier 1973); 2) there was a beech mast seed year in 1971 (Graber and Leak 1992); 3) several years from 1960-1969 were drought years (and the longest recorded drought on record for HB)(Bailey et al. 2003); 4) the winters of 1970-71 and 1974-5 had widespread soil frost (6-15cm in depth in February of those winters)( Bailey et al. 2003). Thus, the origin of the “beech hell” cohort may have been a combination of both seedling influx from the 1971 mast year and sprout production from the two soil frost winters. We suggest that increased recruitment success as a result of canopy opening by both sugar maple decline and beech bark disease has contributed to the development of “beech hell” at the HBEF. In any case, the wave of beech saplings has wrought important changes in the microenvironment that we only partly understand.
Competition with Sugar Maple
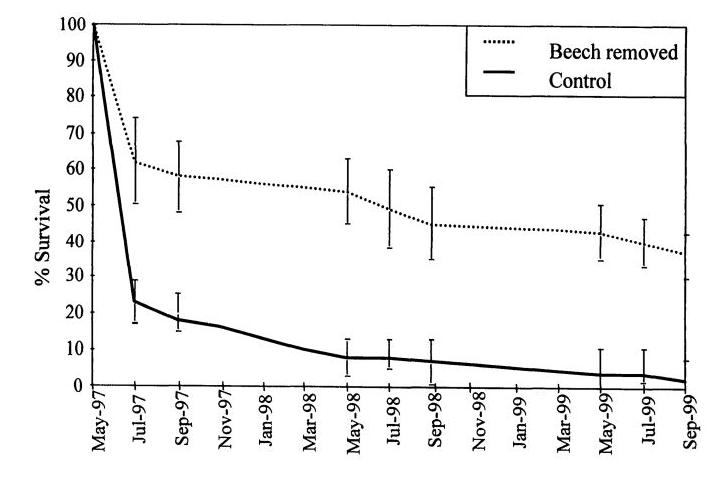
Figure 6. Reproduction of Figure 3 from Chapter 3 of Hane 2001 thesis: Survivorship of sugar maple seedlings during three growing seasons in a control treatment and a treatment in which beech seedlings (< 10 cm DBH) were removed.
The most common associate of American beech throughout its range is sugar maple, one of the dominant canopy species at the HBEF. As slow-growing and extremely understory tolerant trees, these two species exhibit strong competitive interactions (Cleavitt et al. 2021). One key outcome of the development of “beech hell” in the HB forest appears to be competitive exclusion of sugar maple, owing to resource limitations at the seedling stage. Widespread regeneration failure of sugar maple at the HBEF has been attributed in part to soil acidification and calcium depletion (Juice et al. 2006). However, an additional likely factor is competition from the dense understory beech seedling/sapling layer noted above. Hane (2003) recorded survivorship of sugar maple seedlings in plots with experimental cutting of beech saplings in comparison to control plots and those with experimental shading to simulate understory beech. She observed significantly reduced maple survivorship in both cut and shaded plots (Figure 6), indicating that light limitation probably plays a critical role in this competitive interaction. The contribution of this mechanism to the future of sugar maple in the HB forest remains to be conclusively demonstrated.
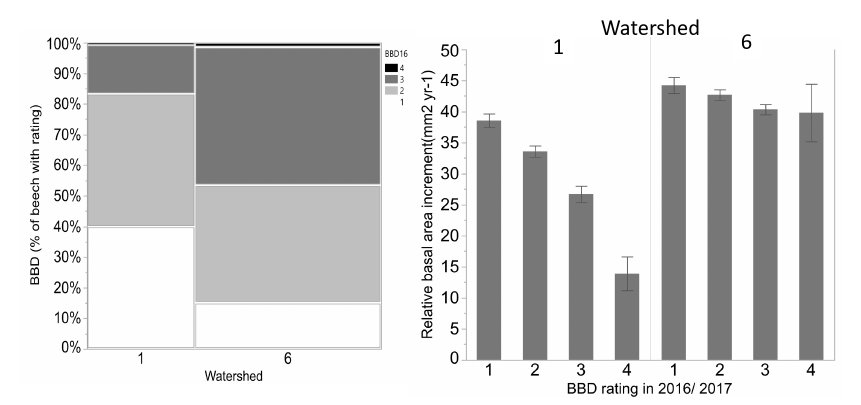
Figure 7. Differences in progression and impact of BBD on watershed 1 (calcium silicate addition and 6 (reference): the left graph shows the reference watershed has more cankering on the trees as more trees have severe (BBD 3 and 4 rating darker gray) and the right graph shows the impact of greater cankering for growth is much more significant on the calcium treated watershed where sugar maple is a stronger competitor.
Presumably, competitive interactions between beech and sugar maple also influence the recruitment, growth and fecundity of canopy trees. As noted earlier, decline of canopy sugar maple, owing primarily to soil acidification, has probably facilitated the expansion of “beech hell”, and experimental evidence indicates that it has also affected beech. As detailed in Forest Composition Chapter, experimental addition of calcium silicate, in an amount designed to replace that lost due to human activity in the 20th century, resulted in a dramatic recovery of sugar maple on watershed 1. The response of beech to this treatment was no less dramatic. Beech is insensitive to soil acidification and the increased vigor of sugar maple resulted in significant response of the progression of beech bark disease on W1 (Figure 7). Thus, the added stress from acid deposition may have favored the maintenance of diseased beech trees on acidified soils throughout the region by reducing competition from declining sugar maple.
Upslope Movement and BBD
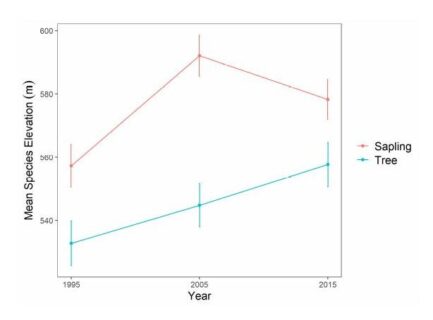
Figure 8. Change in mean species elevation for American beech saplings (2-9.9cm diameter) and tagged trees (≥ 10cm diameter) over 20 years at Hubbard Brook Experimental Forest, NH. Figure adapted from Cleavitt et al. 2022.
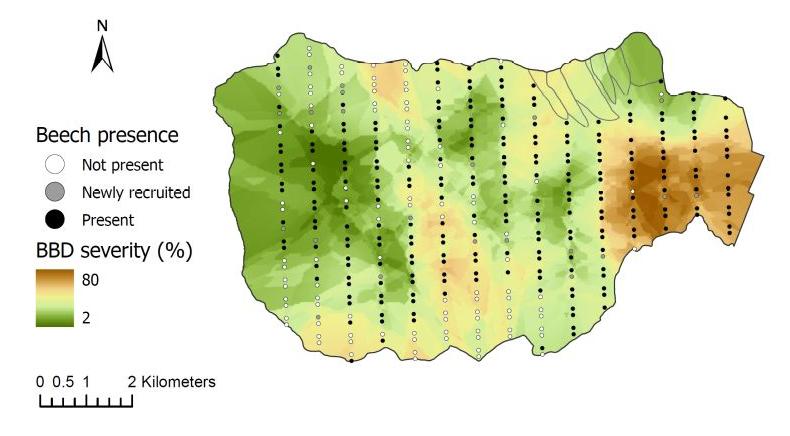
Climate warming is expected to facilitate the upslope movement of forest trees that are thermally restricted (Beckage et al 2008). In fact, beech has been moving upslope in regional montane forests in recent decades. At the HBEF over the past 25 years the average elevation of beech has moved upslope at the rate of about one meter per year (Figure 8) resulting from higher growth and recruitment and lower mortality and BBD disease severity at higher elevations (Cleavitt et al. 2022). The spatial pattern of BBD severity across the HBEF valley illustrates the topographic effect as elevation increases (from 250 to 1100 m) and BBD prevalence clearly decreases from east to west and with increasing elevation (Figure 9). We suggest that the effects of climate warming on the elevational increase in beech abundance may result less from direct effects of warming than from elevational constraints on beech scale prevalence.
Compounded stresses
As if the species didn’t have enough problems already, a recent beech die-off event at HBEF apparently resulted from combined stresses: chronic BBD cambial damage, defoliation from a saddled prominent outbreak (2020) coincident with a protracted heat-drought event (2020-2021). The climatic phenomenon of unusual combinations of heat and drought is clearly a severe threat to the health of many forests (Allen et al. 2015). Although annual precipitation has been steadily increasing at the HBEF (see Climate Change Chapter), the occasional occurrence of protracted drought in combination with exceptional summer warmth may still be a threat. Beech as a genus is known to be drought sensitive (Leuschner 2020), and evidence from Maine also links increased mortality from BBD to drought episodes. At the HBEF, due to this combination of stresses less than half (48%) of beech on the reference watershed remain healthy, another 34% have half or less of their canopy intact and 18% died in the interval 2017-2022 (Cleavitt et al. unpubl. data). Mortality is particularly acute on the upper, steeper slopes with shallow soil (Figure 10). Even in some of the most productive areas of the valley, the recent uptick in beech death was notable. The Bird Area in the central valley had a near doubling in the mortality rate of beech trees during the 2019-2021 census interval (Cleavitt et al. unpubl. data).
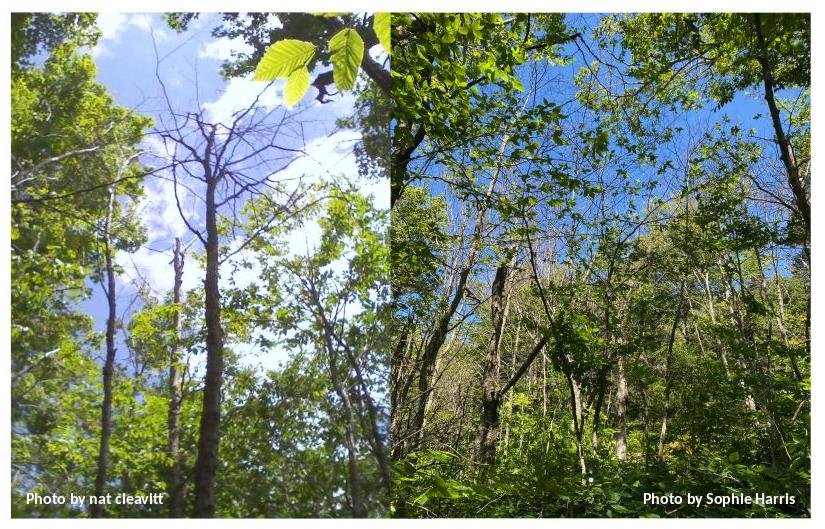
Figure 10. Photos taken in 2022 of canopy beech mortality in the upper slopes of the reference watershed 6 (left) and just west of this area (right).
New fatal threat
First reported from Ohio in 2012, beech leaf disease is associated with a nematode (Litylenchus crenatae mccannii) that has apparently spread rapidly throughout the northeastern range of beech (Ewing et al. 2019). The disease may also involve other pathogens (Ewing 2021) and can be lethal to beech, causing a variety of symptoms in leaves and buds. In 2022, the disease was detected in southern NH and neighboring Maine. Although not yet detected at the HBEF we anticipate that this scourge will appear shortly and wreak destruction! Given the dominance of beech in the regeneration layer, this puts the future of the northern hardwood forest in perhaps the greatest peril to date.
Questions for Further Study
1. What environmental and biotic factors regulate the proportion of beech reproduction by seed vs root sprouting in the Hubbard Brook valley? How does survivorship and susceptibility to disease compare between these two modes?
2. What is the role of hot-drought in the recent declines of beech on the upper slopes of the south-facing watersheds at Hubbard Brook?
3. Will the upslope movement of beech continue to be favored by reduced beech bark disease prevalence at higher elevations?
4. What are the long-term consequences for small mammal populations of continuing decline in beech abundance?
5. What will be the effects on beech demography of the arrival of beech leaf disease in the Hubbard Brook valley?
References
Allen, C. D., Breshears, D. D., & McDowell, N. G. (2015). On underestimation of global vulnerability to tree mortality and forest die‐off from hotter drought in the Anthropocene. Ecosphere, 6(8), 1-55.
Battles, J. J., Fahey, T. J., Driscoll Jr, C. T., Blum, J. D., & Johnson, C. E. (2014). Restoring soil calcium reverses forest decline. Environmental Science & Technology Letters, 1(1), 15-19.
Beckage, B., Osborne B., Gavin D. G., Pucko C., Siccama, T. & Perkins T. 2008. A rapid upward shift of a forest ecotone during 40years of warming in the Green Mountains of Vermont. PNAS 105 (11): 4197-4202.
Cale, J. A. & McNulty S.A. 2018. Not dead yet: Beech trees can survive nearly three decades in the aftermath phase of a deadly forest disease complex. Forest Ecology and Management 409, 372–377.
Cale, J. A., Garrison-Johnston, M. T., Teale, S. A., & Castello, J. D. (2017). Beech bark disease in North America: Over a century of research revisited. Forest Ecology and Management, 394, 86-103.
Cleavitt, N. L., Battles, J. J., Fahey, T. J., & van Doorn, N. S. (2021). Disruption of the competitive balance between foundational tree species by interacting stressors in a temperate deciduous forest. Journal of Ecology, 109(7), 2754-2768.
Cleavitt, N. L., Montague, M., Battles, J. J., Box, O. F., Matthes, J. H., & Fahey, T. (2022). Enemy release from beech bark disease coincides with upslope shift of American beech. Canadian Journal of Forest Research, (ja).
Evans, C. A., Lucas, J. A., & Twery, M. J. (2005). Beech bark disease: proceedings of the beech bark disease symposium. Gen. Tech. Rep. NE-331. Newtown Square PA, US. Department of Agriculture Forest Service, Northern Research Station. 149 p., 331.
Ewing, C. J., Slot, J., Benítez, M. S., Rosa, C., Malacrinò, A., Bennett, A., & Bonello, E. (2021). The Foliar Microbiome Suggests that Fungal and Bacterial Agents May be Involved in the Beech Leaf Disease Pathosystem. Phytobiomes Journal, 5(3), 335-349.
Ewing, C. J., Hausman, C. E., Pogacnik, J., Slot, J., & Bonello, P. (2019). Beech leaf disease: An emerging forest epidemic. Forest Pathology, 49(2), e12488.
Forcier, L. K. (1973). Seedling pattern and population dynamics, and the reproductive strategies of sugar maple, beech and yellow birch at Hubbard Brook. Yale University.
Garnas, J. R., Ayres, M. P., Liebhold, A. M., & Evans, C. (2011). Subcontinental impacts of an invasive tree disease on forest structure and dynamics. Journal of Ecology, 99(2), 532-541.
Graber, R. E., & Leak, W. B. (1992). Seed fall in an old-growth northern hardwood forest (Vol. 663). United States Department of Agriculture, Forest Service, Northeastern Forest Experiment Station.
Griffin, J. M., Lovett, G. M., Arthur, M. A., & Weathers, K. C. (2003). The distribution and severity of beech bark disease in the Catskill Mountains, NY. Canadian Journal of Forest Research, 33(9), 1754-1760.
Hane, E. N. (2003). Indirect effects of beech bark disease on sugar maple seedling survival. Canadian Journal of Forest Research, 33(5), 807-813.
Held, M. E. (1983). Pattern of beech regeneration in the east-central United States. Bulletin of the Torrey Botanical Club, 55-62.
Houston, D. R. (1975). Beech bark disease–the aftermath forests are structured for a new outbreak. Journal of Forestry, 73(10), 660-663.
Houston, D. R. (1994). Major new tree disease epidemics: Beech bark disease. Annual review of phytopathology, 32, 75-87.
Juice, S. M., Fahey, T. J., Siccama, T. G., Driscoll, C. T., Denny, E. G., Eagar, C., ... & Richardson, A. D. (2006). Response of sugar maple to calcium addition to northern hardwood forest. Ecology, 87(5), 1267-1280.
Kasson, M. T., & Livingston, W. H. (2012). Relationships among beech bark disease, climate, radial growth response and mortality of American beech in northern Maine, USA. Forest Pathology, 42(3), 199-212.
Leuschner, C. (2020). Drought response of European beech (Fagus sylvatica L.)—A review. Perspectives in Plant Ecology, Evolution and Systematics, 47, 125576.
Mulder, O., Sleith, R., Mulder, K., & Coe, N. R. (2020). A Bayesian analysis of topographic influences on the presence and severity of beech bark disease. Forest ecology and management, 472, 118198.
Shigo, A. L. (1972). The beech bark disease today in the northeastern US. Journal of Forestry, 70(5), 286-289.
Siccama, T. G., Fahey, T. J., Johnson, C. E., Sherry, T. W., Denny, E. G., Girdler, E. B., ... & Schwarz, P. A. (2007). Population and biomass dynamics of trees in a northern hardwood forest at Hubbard Brook. Canadian Journal of Forest Research, 37(4), 737-749.


